The following analysis can be performed on gene sets, clusters, biclusters, network based modules, similarity based groups, or the filtered dataset (the analyzed set of probes as one set). Before operating any of the group analysis operation (not including the “General enrichment analysis”), the data files for the relevant organism should be downloaded. The files for a specific organism are supplied as one single zip file that you need to download from the Expander download page, section "Organism specific data" (can be reached from inside Expander: Help >> Open download page, or from updates.html file in your Expander directory). Then, you extract the file into "Expander/organisms" directory. The relevant directories will be built by the extraction, inside your "Expander/organisms" directory. For example, after extracting human data, you should have "Expander/organisms/human" directory.
This tool performs basic statistical analysis on the distribution of functions of genes within each cluster. The functions of the genes are determined according to annotation files (GO), which can be downloaded from the EXPANDER download page (see the Supplied Files section). To perform this analysis, Expander utilizes the TANGO software, which performs hyper-geometric enrichment tests and corrects for multiple testing by bootstrapping and estimating the empirical p-value distribution for the evaluated sets.
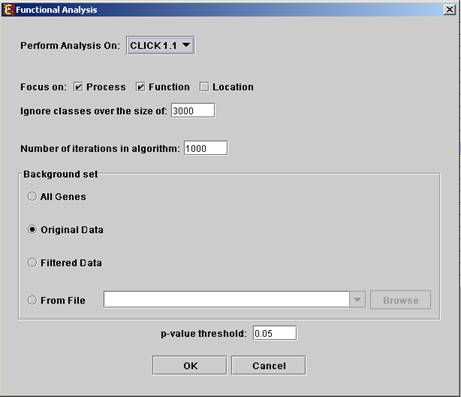
Before operating functional analysis the annotation files for the relevant organism should be downloaded from the download page (more details at introduction of Group_Analysis Tools). To perform the analysis, select Group Analysis >> Functional Analysis >> TANGO. The following dialog box will appear:
The following table specifies the different parameters that can be set
via this dialog box:
|
Field |
Description |
|
Perform analysis on |
The grouping solution on which the analysis will be performed. |
|
Include back nodes |
Include genes that are part of the module' but not included in the GE data (Relevant only if the analysis is performed on modules, detected by network based algorithm) |
|
Focus on |
Can be used to select annotation subtypes that are of interest (Process, Function and Location). And the analysis will focus on these types only. |
|
Ignore classes over the size of |
This parameter states the level in the GO tree at which annotations are too general (class size indicates how general it is) and are thus no longer interesting. |
|
Number of iterations in algorithm |
The number of random sampling performed by the algorithm. Increasing this parameter, will increase runtime and will provide higher resolution on corrected p-Values. I.e., corrected p-Values will range between 1/<#iterations> and 1. |
|
Background set |
Determines the set of genes that will be used as background in the analysis. Options are: all genes (of the relevant organism), original input data, filtered data or background set from file (see the Files Format section for details regarding the format of an external background set). |
|
Corrected p-value threshold |
A functional class will be considered significantly enriched in a cluster/bicluster if its corrected p-value is lower than this threshold. The value in this field should be at least 1/1000, since the TANGO algorithm performs 1000 bootstraps in order to estimate the corrected p-value. |
Upon clicking ‘OK’ in the dialog box, the TANGO algorithm is operated.
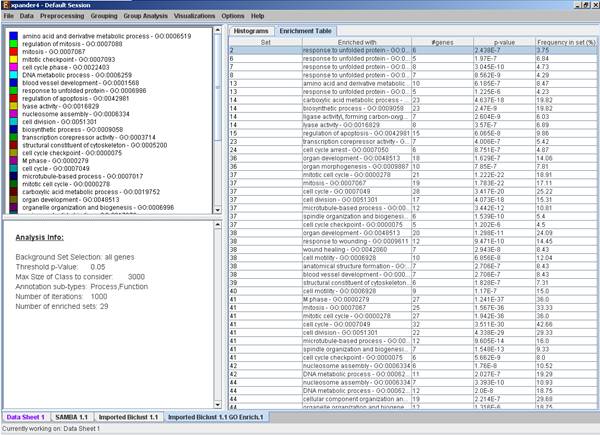
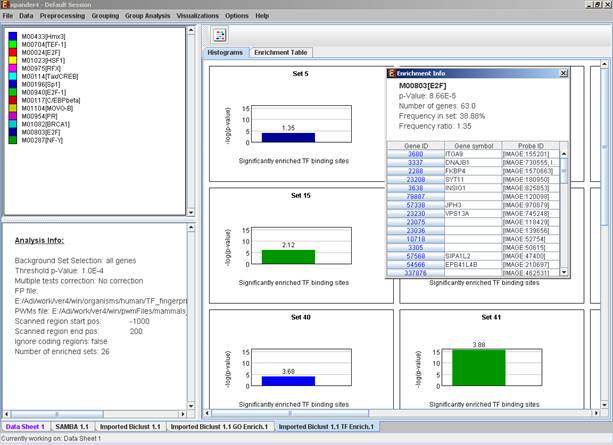
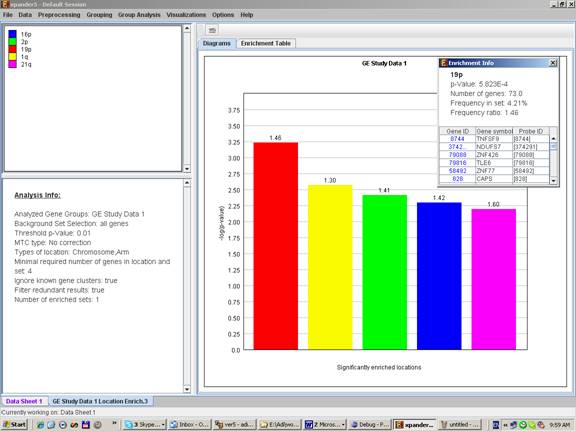
After functional analysis is performed a functional analysis solution visualization tab is added to the main window. It contains general information regarding the analysis, a sort-able table holding all detected enrichments (set ID, functional class, p-value, etc.) and a multi-histogram panel along with a color index (mapping each color to a corresponding functional class). The multi-histogram panel contains one histogram for each probe/gene set/group in which enrichment has been detected. Each histogram contains a column for each significant (more frequent than would be expected by random) functional class. The definition of significant depends on the user’s selection of threshold p-value i.e., a functional class is considered significantly enriched in a cluster/bicluster if its corrected p-value is lower than the preset threshold p-value.
The height of the column is proportional to the significance of this enrichment (i.e. height = -log(raw p-value)). The frequency in set (frequency of genes of a functional class within the examined set, in %) is written on top of the column. Upon clicking on a column, a dialog box is displayed containing the class name, raw p-value, corrected p-value, and a list of the genes in the cluster/bi-cluster that belong to the class. Upon clicking on one of the gene Ids in the table, a relevant web page with information regarding this gene is displayed. The display tool tip shows the cluster number, size and homogeneity.

Annotation files are currently supplied with EXPANDER for yeast, human, mouse, rat, fly, zebrafish, c-elegans, Arabidopsis, chicken and E. coli, and are updated on a regular basis (for more information, refer to the Supplied Files section).
The results of this analysis can be exported to a text file (using the display menu item Group Analysis >> Functional Analysis >> Export Results).
This tool identifies TFs whose binding sites are significantly over-represented in a given set of promoters (i.e. cluster or bicluster). To perform this analysis Expander utilizes the PRIMA (PRomoter Integration in Microarray Analysis) software which performs a statistical analysis on the distribution of transcription factor motifs in the promoters of genes within each cluster or bicluster. To achieve this, PRIMA uses preprocessed TF fingerprint files, which can be downloaded from the EXPANDER download-page (see the Supplied Files section), and are updated on a regular basis. For details regarding the PRIMA software see the References section.
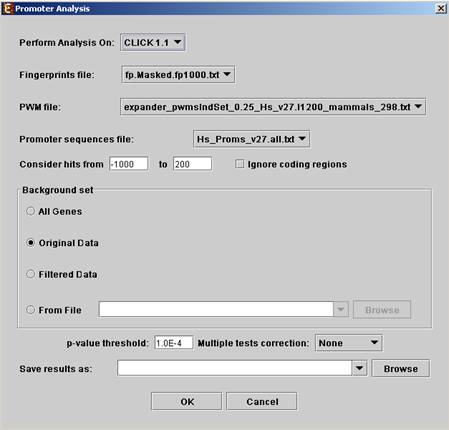
Before operating promoter analysis, the TF fingerprint file for the relevant organism should be downloaded from the download page (more details at introduction of Group Analysis Tools). To perform the analysis select Group Analysis >> Promoter Analysis >> PRIMA. The following dialog box will appear:
The following table specifies the different parameters that can be set via this dialog box:
|
Field |
Description |
|
Perform analysis on |
The grouping solution on which the analysis will be performed. |
|
Include back nodes |
Include genes that are part of the module' but not included in the GE data (Relevant only if the analysis is performed on modules, detected by network based algorithm) |
|
Fingerprints file |
Automatically set according to the selection of the organism. |
|
PWM file |
Automatically set according to the selection of the organism. |
|
Promoter sequences file |
Contains the gene sequences that are used for the TF binding sites display. Automatically set according to the selection of the organism. |
|
Hits range |
Determines which regions of the gene are to be analyzed. The possible range depends on the investigated organism (i.e. on the information provided in the TF fingerprint files), and is specified in the Supplied Files section. |
|
Background set |
Determines the set of genes that will be used as background in the analysis. Options are: all genes (of the relevant organism), original input data, filtered data or background set from file (see the Files Format section for details regarding the format of an external background set). |
|
Threshold p-value |
A TF's binding site will be considered significantly enriched in a cluster if its corrected p-value is lower than this threshold. |
|
Multiple tests correction |
Can be set to Bonferroni or None (when set to Bonferroni the corrected p-values are the ones that are compared to the threshold p-value). |
|
Save results as |
When filled, the program results are saved in stated txt file. |
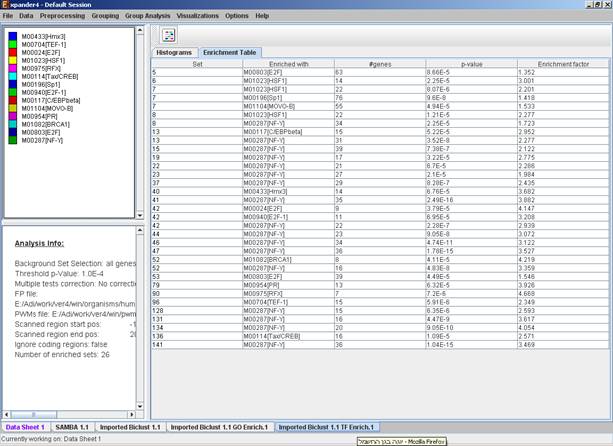
After promoter analysis is performed, a promoter analysis solution visualization tab is added to the main window. It contains general information regarding the analysis, a sort-able table holding all detected enrichments (set ID, TF binding site, p-value, etc.) and a multi-histogram panel along with a color index (mapping each color to a corresponding TF binding site). The multi-histogram panel contains one histogram for each probe/gene set/group in which enrichment has been detected. Each histogram contains a column for each significant (more frequent than would be expected by random) TF binding site. The definition of significant depends on the user’s selection of threshold p-value. i.e., a TF binding site is considered significantly enriched in a cluster/bicluster if its corrected p-value is lower than the preset threshold p-value.
The height of a column is proportional to the significance of this enrichment (i.e. height = -log(p-value)), and the frequency ratio (frequency in set divided by frequency in background) is written on top of the column. Upon clicking on a column, a dialog box is displayed containing:
TF accession number in TRANSFAC DB [TF name], p-value, % of covered promoters in cluster, relative frequency (frequency in cluster divided by frequency in background set) and a list of the genes in the cluster which contain the motif in their promoters. Upon clicking on one of the gene Ids in the table, a relevant web page with information regarding this gene is displayed. The display tool tip shows the cluster number, size and homogeneity.
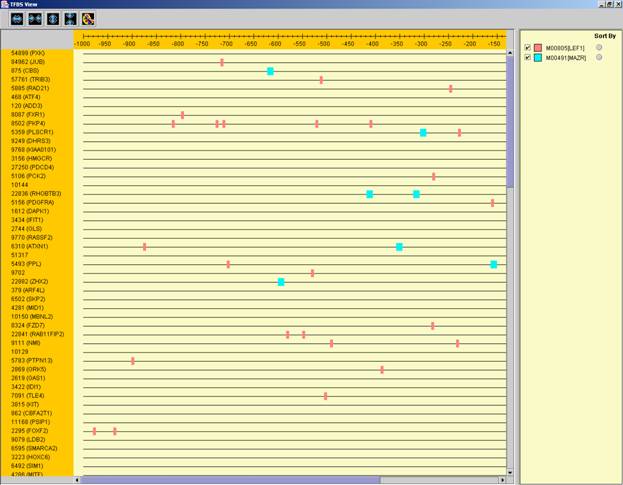
After performing promoter analysis, TF binding sites can be viewed by
selecting Group Analysis >> Promoter Analysis >> View Binding
Sites OR by pressing the toolbar button (![]() ). After selecting the gene group
(cluster/bi-cluster etc.) to be viewed, a separate frame is displayed,
containing a line to represent each of the genes in the group, and a colored
rectangle, to represent each binding site. A color index appears on the right,
mapping each color to the corresponding TF (PWM). A check box next to each of
the entries in the color index allows hiding any of the PWMs, and a radio
button next to each of the entries in the color index allows sorting the genes
in the display according to the number of hits of the corresponding TF. The
toolbar contains tools for vertical and horizontal zooming. If a sequence file
had been selected via the promoter analysis input dialog, the actual sequence
will be displayed when the zoom factor (scale) allows it.
). After selecting the gene group
(cluster/bi-cluster etc.) to be viewed, a separate frame is displayed,
containing a line to represent each of the genes in the group, and a colored
rectangle, to represent each binding site. A color index appears on the right,
mapping each color to the corresponding TF (PWM). A check box next to each of
the entries in the color index allows hiding any of the PWMs, and a radio
button next to each of the entries in the color index allows sorting the genes
in the display according to the number of hits of the corresponding TF. The
toolbar contains tools for vertical and horizontal zooming. If a sequence file
had been selected via the promoter analysis input dialog, the actual sequence
will be displayed when the zoom factor (scale) allows it.
TF motif fingerprint files and promoter sequence files are currently supplied with EXPANDER for yeast, human, mouse, rat, fly, zebrafish, c-elegans, arabidopsis and chicken, and are updated on a regular basis (for more information, refer to the Supplied Files section).
The results of this analysis can be exported to a text file (using the display menu item Group Analysis >> Promoter Analysis >> Export Results).
This tool performs basic statistical analysis on the distribution of chromosomal locations of genes within each group. The locations of the genes are specified in organism-specific data files, which can be downloaded from the EXPANDER download-page (see the Supplied Files section).
Before operating location analysis, the location data for the relevant organism should be downloaded from the download page (more details at introduction of Group Analysis Tools). In this analysis, hyper-geometric enrichment tests are performed, and the results can be (if requested) corrected for multiple testing using the Bonferroni correction.
To perform the analysis, select Group Analysis >> Location Analysis >> Detect Enrichment. The following dialog box will appear:
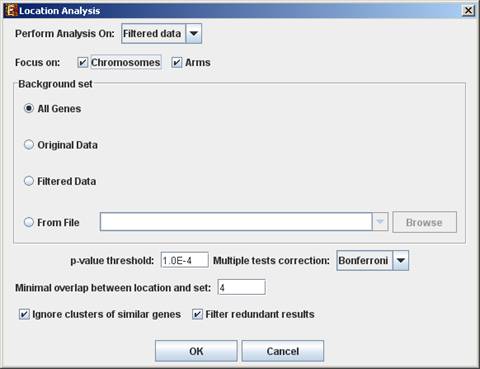
The following table specifies the different parameters that can be set
via this dialog box:
|
Field |
Description |
|
Perform analysis on |
The grouping solution on which the analysis will be performed. |
|
Include back nodes |
Include genes that are part of the module' but not included in the GE data (Relevant only if the analysis is performed on modules, detected by network based algorithm) |
|
Focus on (Chromosomes, Arms*, Bands*)
|
Location types to perform analysis on. |
|
Background set |
Determines the set of genes that will be used as background in the analysis. Options are: all genes (of the relevant organism), original input data, filtered data or background set from file (see the Files Format section for details regarding the format of an external background set). |
|
p-value threshold |
A category/attribute will be considered significantly enriched in a cluster/bicluster if its corrected p-value is lower than this threshold. |
|
Multiple tests correction |
Can be set to Bonferroni or None (when set to Bonferroni the corrected p-values are the ones that are compared to the threshold p-value). |
|
Minimal overlap between category and set |
The minimal number of genes from a group (cluster/bi-cluster/module etc.) expected to be categorized/attributed by an attribute in order for its enrichment to be accepted. |
|
Ignore clusters of similar genes* |
If selected, genes from known homology clusters are not included in the analysis. |
|
Filter redundant results |
If selected, the results are filtered, so that out of two enrichments of overlapping areas in the same group, only one is selected (the most significant one). |
* If relevant data exists
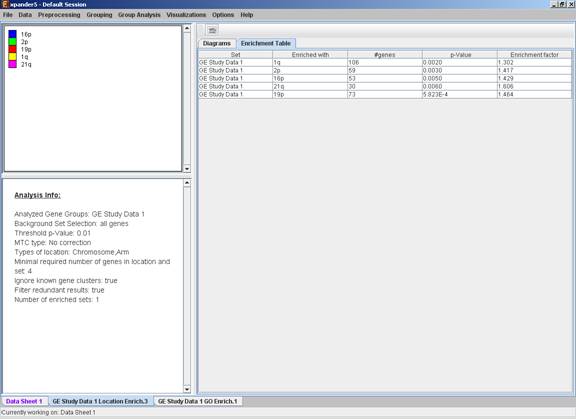
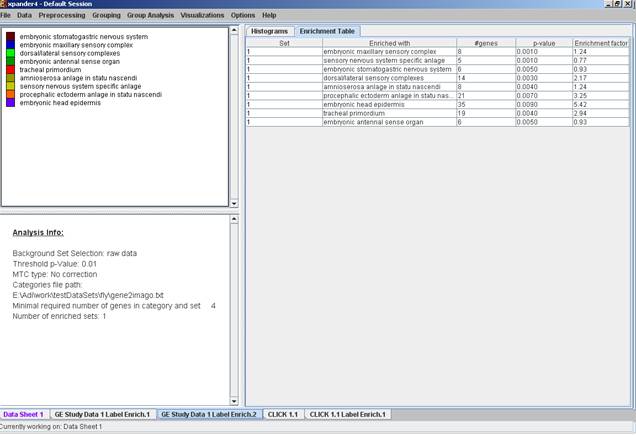
After the analysis is performed an enrichment analysis solution visualization tab is added to the main window. It contains general information regarding the analysis, a sort-able table holding all detected enrichments (set ID, enrichment category, p-value, etc.) and a multi-histogram panel along with a color index (mapping each color to a corresponding location). The multi-histogram panel contains one histogram for each probe/gene group in which enrichment has been detected. Each histogram contains a column for each significant (more frequent than would be expected by random) location. The definition of significant depends on the user’s selection of threshold p-value i.e., a category is considered significantly enriched in a cluster/bicluster if its corrected p-value is lower than the preset threshold p-value.
The height of the column is proportional to the significance of this enrichment (i.e. height = -log(raw p-value)), and the frequency ratio (frequency in set divided by frequency in background) is written on top of the column. Upon clicking on a column, a dialog box is displayed containing the location, corrected p-value, and a list of the genes in the group that are mapped to this location. Upon clicking on one of the gene Ids in the table, a relevant web page with information regarding this gene is displayed.
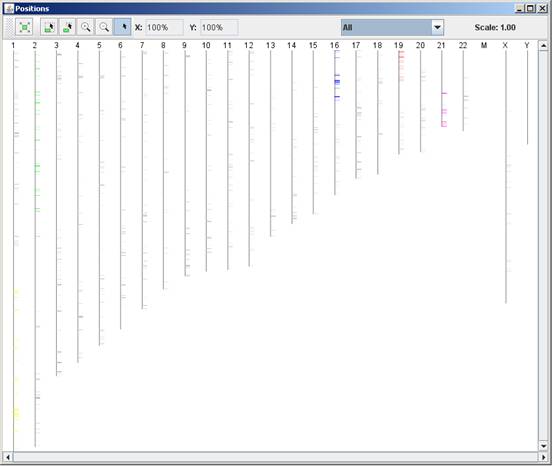
After performing location enrichment analysis, the locations can be
viewed by selecting Group Analysis >> Location Analysis >> View
Locations OR by pressing the toolbar button (![]() ). After selecting the gene group
(cluster/bi-cluster etc.) to be viewed, a separate frame is displayed,
containing an image of all chromosomes on which the positions of the genes in
the group are marked. If the gene is located on an area that was identified to
be enriched in that group, its position is marked in the same color to this
area the enrichment results histogram.
). After selecting the gene group
(cluster/bi-cluster etc.) to be viewed, a separate frame is displayed,
containing an image of all chromosomes on which the positions of the genes in
the group are marked. If the gene is located on an area that was identified to
be enriched in that group, its position is marked in the same color to this
area the enrichment results histogram.
The results of this analysis can be exported to a text file (using the display menu item Group Analysis >> Location Analysis >> Export Results).
This tool performs a statistical analysis on the distribution of miRNA target gene within each group. The miRNA targets information is supplied in organism-specific data files, which can be downloaded from the EXPANDER download-page (see the Supplied Files section). For this analysis, Expander utilizes the FAME algorithm, which performs empirical tests using a sampling technique (random permutations) to estimate the empirical p-value distribution for the evaluated groups. This is done while accounting for biases in the 3' UTR sequences
Before operating miRNA enrichment analysis, the location data for the relevant organism should be downloaded from the download page (more details at introduction of Group Analysis Tools). In this analysis, hyper-geometric enrichment tests are performed, and the results can be (if requested) corrected for multiple testing using the Bonferroni correction.
To perform the analysis, select Group Analysis >> miRNA Analysis >> FAME. The following dialog box will appear:
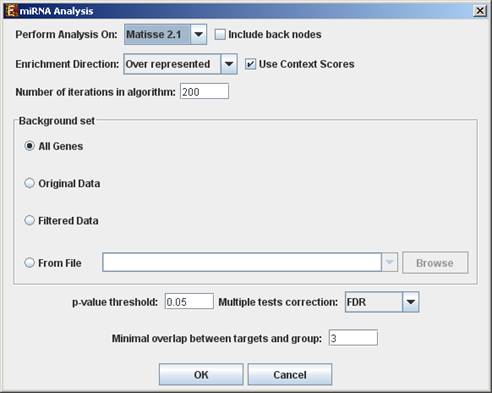
The following table specifies the different parameters that can be set via
this dialog box:
|
Field |
Description |
|
Perform analysis on |
The grouping solution on which the analysis will be performed. |
|
Include back nodes |
Include genes that are part of the module' but not included in the GE data (Relevant only if the analysis is performed on modules, detected by network based algorithm) |
|
Enrichment Direction
|
Allows to choose between searching for over-represented targets and searching for under-represented targets. |
|
Use context scores |
If context scores are used, FAME will assign a higher weight to miRNA-gene pairs for which at least one target site has a high maximal context score (see References section for further details). |
|
Number of Iterations |
The number of random permutations used for the empirical tests. |
|
Background set |
Determines the set of genes that will be used as background in the analysis. Options are: all genes (of the relevant organism), original input data, filtered data or background set from file (see the Files Format section for details regarding the format of an external background set). |
|
p-value threshold |
A category/attribute will be considered significantly enriched in a cluster/bicluster if its corrected p-value is lower than this threshold. |
|
Multiple tests correction |
Can be set to FDR, Bonferroni or None (when set to Bonferroni/FDR the corrected p-values are the ones that are compared to the threshold p-value). |
|
Minimal overlap between targets and group |
The minimal number of genes from a group (cluster/bi-cluster/module etc.) expected to be categorized/attributed by an attribute in order for its enrichment to be accepted. |
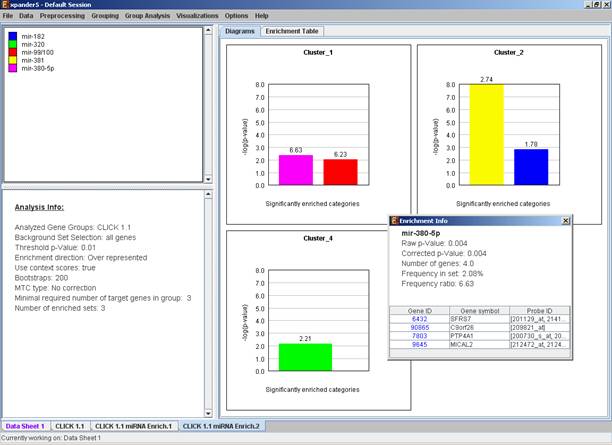
After the analysis is performed an enrichment analysis solution visualization tab is added to the main window. It contains general information regarding the analysis, a sort-able table holding all detected enrichments (group name, enriched miRNA target, p-value, etc.) and a multi-histogram panel along with a color index (mapping each color to a corresponding miRNA). The multi-histogram panel contains one histogram for each probe/gene group in which enrichment has been detected. Each histogram contains a column for each significant (more frequent than would be expected by random) miRNA target. The definition of significant depends on the user’s selection of threshold p-value i.e., an mRNA target is considered significantly enriched in a group of genes if its corrected p-value is lower than the selected threshold p-value.
The height of the column is proportional to the significance of this enrichment (i.e. height = -log(raw p-value)), and the frequency ratio (frequency in set divided by frequency in background) is written on top of the column. Upon clicking on a column, a dialog box is displayed containing the miRNA name, corrected p-value, and a list of the genes in the group that are mapped to this location. Upon clicking on one of the gene Ids in the table, a relevant web page with information regarding this gene is displayed.
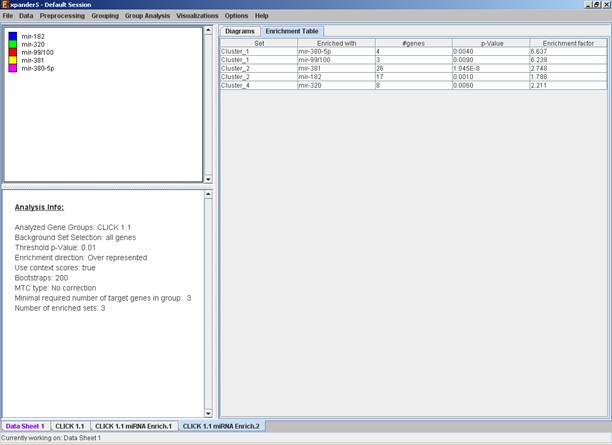
The results of this analysis can be exported to a text file (using the display menu item Group Analysis >> miRNA Analysis >> Export Results).
This tool performs basic statistical analysis on the distribution of categories/attributes of genes within each group. The categories/attributes of the genes are to be determined by the user and imported as a text (for details regarding the required format, see the File Formats section). In this analysis, hyper-geometric enrichment tests are performed, and the results can be (if requested) corrected for multiple testing using the Bonferroni correction.
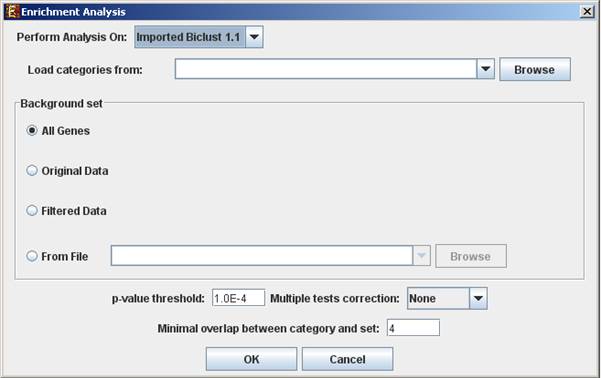
To perform the analysis, select Group Analysis >> General Enrichment Analysis >> Detect Enrichment. The following dialog box will appear:
The following table specifies the different parameters that can be set
via this dialog box:
|
Field |
Description |
|
Perform analysis on |
The grouping solution on which the analysis will be performed. |
|
Include back nodes |
Include genes that are part of the module' but not included in the GE data (Relevant only if the analysis is performed on modules, detected by network based algorithm) |
|
Load categories from |
Input field for the file path, holding the gene categories/attributes. |
|
Background set |
Determines the set of genes that will be used as background in the analysis. Options are: all genes (of the relevant organism), original input data, filtered data or background set from file (see the Files Format section for details regarding the format of an external background set). |
|
p-value threshold |
A category/attribute will be considered significantly enriched in a cluster/bicluster if its corrected p-value is lower than this threshold. |
|
Multiple tests correction |
Can be set to Bonferroni or None (when set to Bonferroni the corrected p-values are the ones that are compared to the threshold p-value). |
|
Minimal overlap between category and set |
The minimal number of genes from a cluster/bi-cluster expected to be categorized/attributed by an attribute in order for its enrichment to be accepted. |
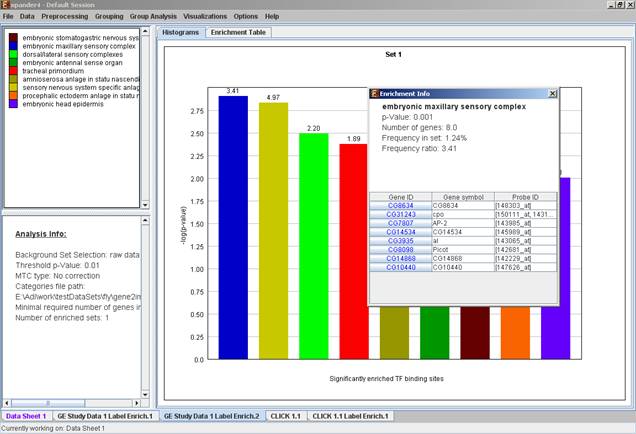
After the analysis is performed an enrichment analysis solution visualization tab is added to the main window. It contains general information regarding the analysis, a sort-able table holding all detected enrichments (set ID, enrichment category, p-value, etc.) and a multi-histogram panel along with a color index (mapping each color to a corresponding category). The multi-histogram panel contains one histogram for each probe/gene set/group in which enrichment has been detected. Each histogram contains a column for each significant (more frequent than would be expected by random) category. The definition of significant depends on the user’s selection of threshold p-value i.e., a category is considered significantly enriched in a cluster/bicluster if its corrected p-value is lower than the preset threshold p-value.
The height of the column is proportional to the significance of this enrichment (i.e. height = -log(raw p-value)), and the frequency ratio (frequency in set divided by frequency in background) is written on top of the column. Upon clicking on a column, a dialog box is displayed containing the class name, corrected p-value, and a list of the genes in the cluster/bi-cluster that belong to the category. Upon clicking on one of the gene Ids in the table, a relevant web page with information regarding this gene is displayed. The display tool tip shows the cluster number, size and homogeneity.
The results of this analysis can be exported to a text file (using the display menu item Group Analysis >> General Enrichment Analysis >> Export Results).
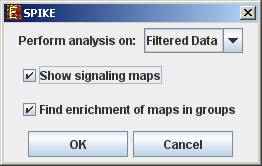
This tool allows browsing through signaling data to view the sub-graphs that are induced by the analyzed gene groups. It also enables the user to search for statistical enrichment of these groups in highly curated signaling maps. To perform this task, Expander interfaces with the SPIKE software and database. For further information regarding the SPIKE software see the References section.
To perform the analysis on one/more of the gene groups defined in Expander (i.e. clusters, bi-clusters, modules, loaded gene sets or filtered data), select Group Analysis >> Network >> SPIKE>>Gene Groups. The following dialog box will appear:
The following table specifies the different parameters that can be set via this dialog box:
|
Description |
|
|
Perform analysis on |
The grouping solution on which the analysis will be performed. |
|
Show signaling Maps |
For each group display regulatory data induced by the genes included in the group. |
|
Find enrichment of maps in groups |
For each group, search for signaling maps that are enriched with genes included in the group. |
Pressing OK in the dialog box will launch the SPIKE application. When operated for the first time, the launch takes a few minutes, since it has to build a local database. From this point on, please refer to page 12 in the SPIKE user manual.
SPIKE can also be operated on a sub-group of genes that is derived from an existing enrichment solution in Expander. I.e. a group of genes that has a common annotation that was found to be enriched by one of the group analysis operations. In order to operate SPIKE on such a group, select: Group Analysis>>Network>> SPIKE>>Enrichment Derived Sets.