A
Tool For Reconstructing Gene Regulatory Networks
|
 |
ModEnt is a computational tool that
reconstructs gene regulatory networks from high throughput experimental
data. The method used by ModEnt is desribed in the following paper.
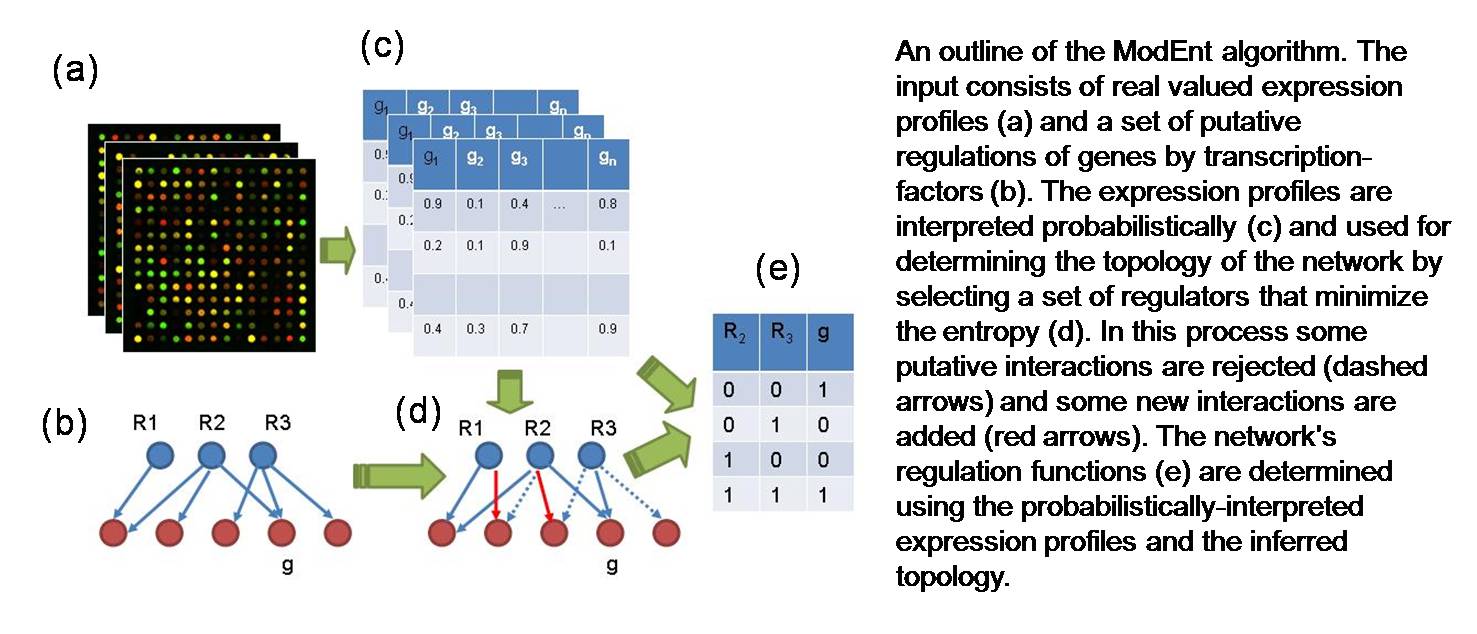
Overview of ModEnt
What do I need to do in order to run the
analysis on my data?
You need to prepare the input files that
are described below, and put them in the same
directory with the program that you downloaded. Three of the
input files are obligatory, and the fourth is optional.
The program is run from the command line. The command line arguments
are also described below.
The program output files are generated in the
same directory.
There are three obligatory input files that you need to prepare in
order to run the analysis.
The first file is the chip features file. This files provides
information about the different experiments. It has a simple
tab-delimited format. Name this file "Features.txt".
The second file is the regulators file. The regulators file is a
list of ther names of all the regulators that you want to
consider. If every gene is a potential regulator, the list should
contain all the genes. Name this file "Regulators.txt".
The third file is the expression file. It contains a table of the
expression values of all the genes over all the experiments. Each
column corresponds to a different gene, and each row to a different
experiment. Name this file "ExpressionData.txt".
The fourth, and optional file, is the knowledge file. It contains
a-priori knowledge that you have about the network. Name this file
Knowledge.txt
Following are descriptions of the input files and some samples.
The Chip Features File
This
file
contains
a
description
of
all
the
chips
in
the
dataset.
The
information
that
should
be
provided
in
the
features
file
is
as
follows:
Experiment: The
experiment number
Conditions: This
practically means experimental conditions. Multiple values should be
separated by commas. If these are not available use the notation NA
instead. See also the example table.
Condition
levels:
This
strength
of
the
different
conditions.
Multiple
values
should
be
separated
by commas. (values between 0.0 and 1.0). If these
are not available use the notation NA instead. See the example table.
Strain:
The
strain
of
cells
that
were
used
in
the
experiment.
If
these are not
available use the notation NA instead. See the example
table.
Deleted
Genes:
The
names
of
the
genes
that
were
deleted
in
the
experiment.
Multiple values should be separated by commas. If these are not
available use the notation NA instead. See the example
table.
Overexpressed
Genes:
The
names
of
the
genes
that
were
over-expressed
in
the
experiment.
Multiple values should be separated by commas. If these are
not available use the notation NA instead. See the example
table.
Time:
If
part
of
a
time-series,
the
time
of
the
experiment.
Note
that
time-series experiments should be listed consecutively. If these are
not available use the notation NA instead. See the example
table.
As
mentioed
above,
in
order
to
indicate
that
a
field
is
not available,
use the notation NA. If you use NA in the time-series column, it
means that the experiment is not part of a time-series.
The following table provides an example:
| #Experiment |
Conditions |
ConditionLevels |
Strain |
DeletedGenes |
OverexpressedGenes |
Time |
| 1 |
NA |
NA |
NA |
NA |
NA |
NA |
2
|
NA |
NA |
NA |
NA |
NA |
NA |
3
|
NA |
NA |
NA |
NA |
NA |
NA |
4
|
C1 |
0.5 |
NA |
NA |
NA |
NA |
5
|
C1 |
1.0 |
NA |
NA |
NA |
NA |
6
|
NA |
NA |
NA |
NA |
NA |
0 |
7
|
NA |
NA |
NA |
NA |
NA |
30 |
8
|
NA |
NA |
NA |
NA |
NA |
60 |
9
|
NA |
NA |
NA |
G5 |
NA |
NA
|
10
|
NA |
NA |
NA |
G7 |
NA |
NA
|
11
|
NA |
NA |
NA |
G5,G8 |
NA |
NA |
12
|
C2,C3 |
NA |
NA |
NA |
G4 |
NA |
13
|
C2,C3 |
NA |
S1
|
NA |
G4 |
NA |
Row 1 means that in the first experiment we do not provide information
about experimental conditions or the strain, none of the genes were
overexpressed or deleted, and the chip was not a part of time-series.
Row 5 means that in the fifth experiment the experimental condition was
the same as in the fourth experiment but at double intensity.
Row 7 means that the seventh experiment was the second time point in a
time-series that started in the experiment of row 6.
Row 9 means that in the ninth experiment the gene called "G5" was
deleted.
An example for a features file can be found here.
The Regulators File
This file contains a list of all the genes that may regulate other
genes. Make sure that the names of the genes that are listed as
regulators are identical to the names that you use in the features file
and the expression file.
An example for a regulators file can be found here.
The Expression File
The expression file contains the microarray expression values for all
the genes. Make sure that the names of the genes that are listed
are identical to the names that you use in the features file and the
regulators file.
An example for an expression file can be found here.
This input file is optional. It contains regulator-gene connections
that are retrieved from the literature or from other types of
experimental data such as ChIP-chip.
These connections are given as tab-delimited triplets: Regulator Gene
Confidence
An example for an expression file can be found here.
If you use a knowledge file, name it Knowledge.txt.
The program can take the following command line arguments:
-f : This will run a faster algorithm that may be less accurate but
will reduce running time significantly. Recommended for large networks.
-r : Change the default maximal number of regulators per gene. The
default number is 3. For example, using -r 10 will allow every gene to
have up to 10 regulators.
-l : If you want the program to find the logic tables that describe how
the regulators of each gene affect it, use this option. This option
increases the running time.
-c : Clusters together all the genes that have the same regulators.
-k : Use a given network topology, and compute only the logic tables
(in this case you need to provide a knowledge
file). Use this option in addition to the -l option.
The Results File
The results file contains lines of the following format:
Regulator Regulatee pp
where Reglator is a name of a gene from the regulators file, and
Regulatee is any other gene. Such a triplet means that Regulator
is predicted to regulate Regulatee.
The "pp" is added for visualization purposes - it allows you to view
all the predicted regulations as a network using Cytoscape.
The file name of the results file is Results.txt
The Logic File
This file gives the logic tables for every gene in the network. It is
only generated if you use the -l option.
For example, if the results file contains the following regulators(in
this order) for Gene1:
Regulator1 Gene1 pp
Regulator2 Gene1 pp
and the logic file shows the table:
Gene1
0 0 | 0
1 0 | 1
0 1 | 1
1 1 | 1
The first column corresponds to the level of Regulator1, the second
column to the level of Regulator2, and the third column (after the |)
to the level of Gene1.
In this example when either of Regulator1 or Regulator2 has level 1,
the level of Gene1 changes to 1. When both of these regulators have
level 0, then the level of Gene1 will also be 0.
The file name of the logic file is Logic.txt.
The Cohorts File
This file lists groups of genes ("cohorts") that have the exact same
regulator set. It is only generated if you use the -c option.
The file name of the cohorts file is Cohorts.txt
Karlebach, G. and Shamir, R., Constructing logical models
of gene regulatory networks by integrating transcription factor-DNA
interactions with expression data: an entropy based approach. Journal
of
Computational
Biology. In Press. PDF
Supplementary Material
Contact Us
If you have any questions, don't hesitate to contact us at

ModEnt was developed by Guy
Karlebach at Ron Shamir's
Computational Genomics Group , Tel Aviv University.