| Home |
| Algorithms |
| Screenshots |
| User manual |
| Hands on |
| Download |
| Citations |
| References |
| version history |
| Acknowledgements |
| Google Forum |
| Contact Us |
|
|
| Expander screenshots: |
|
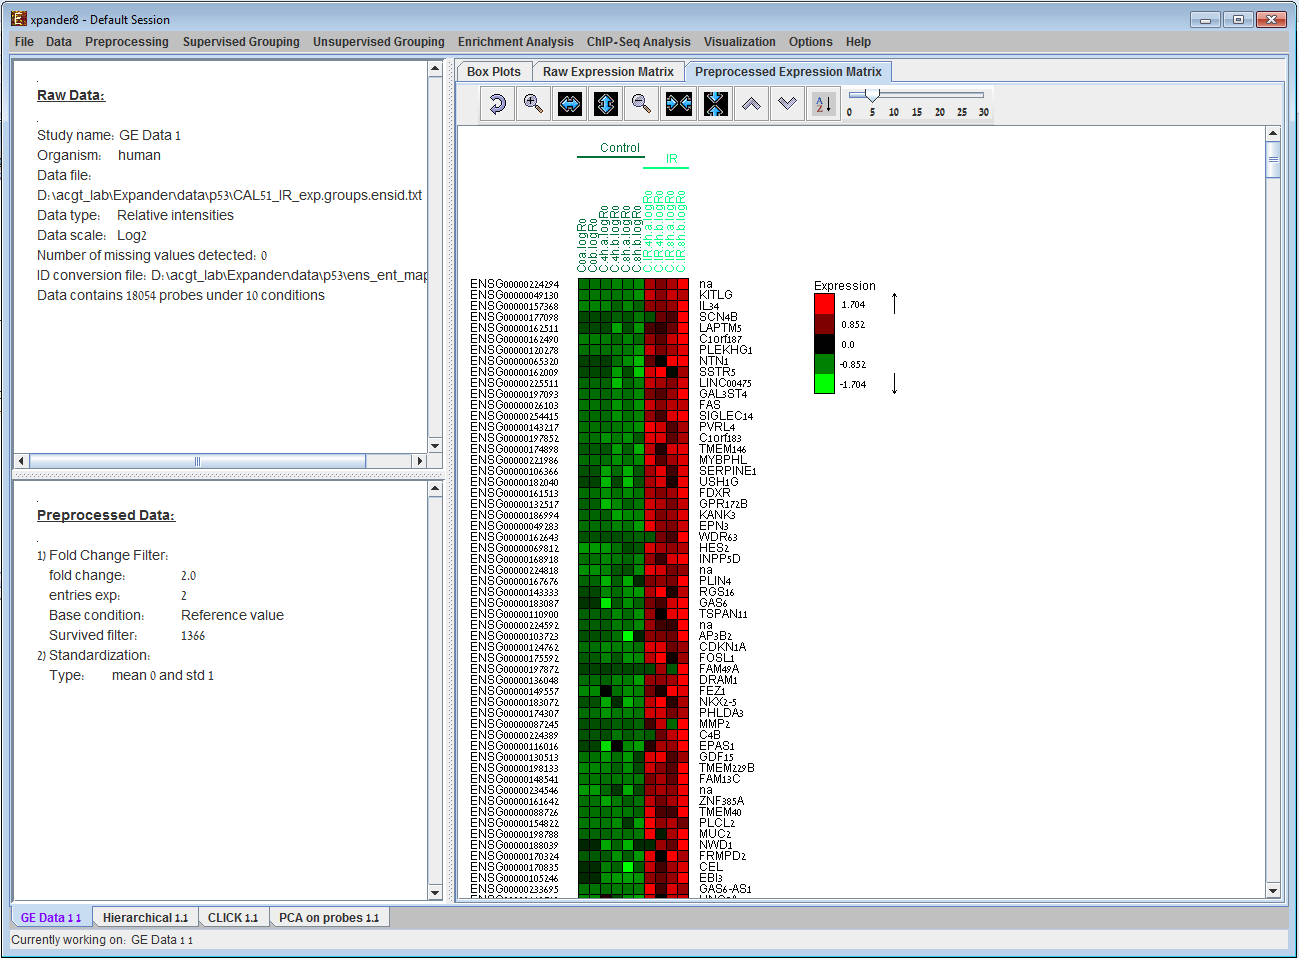
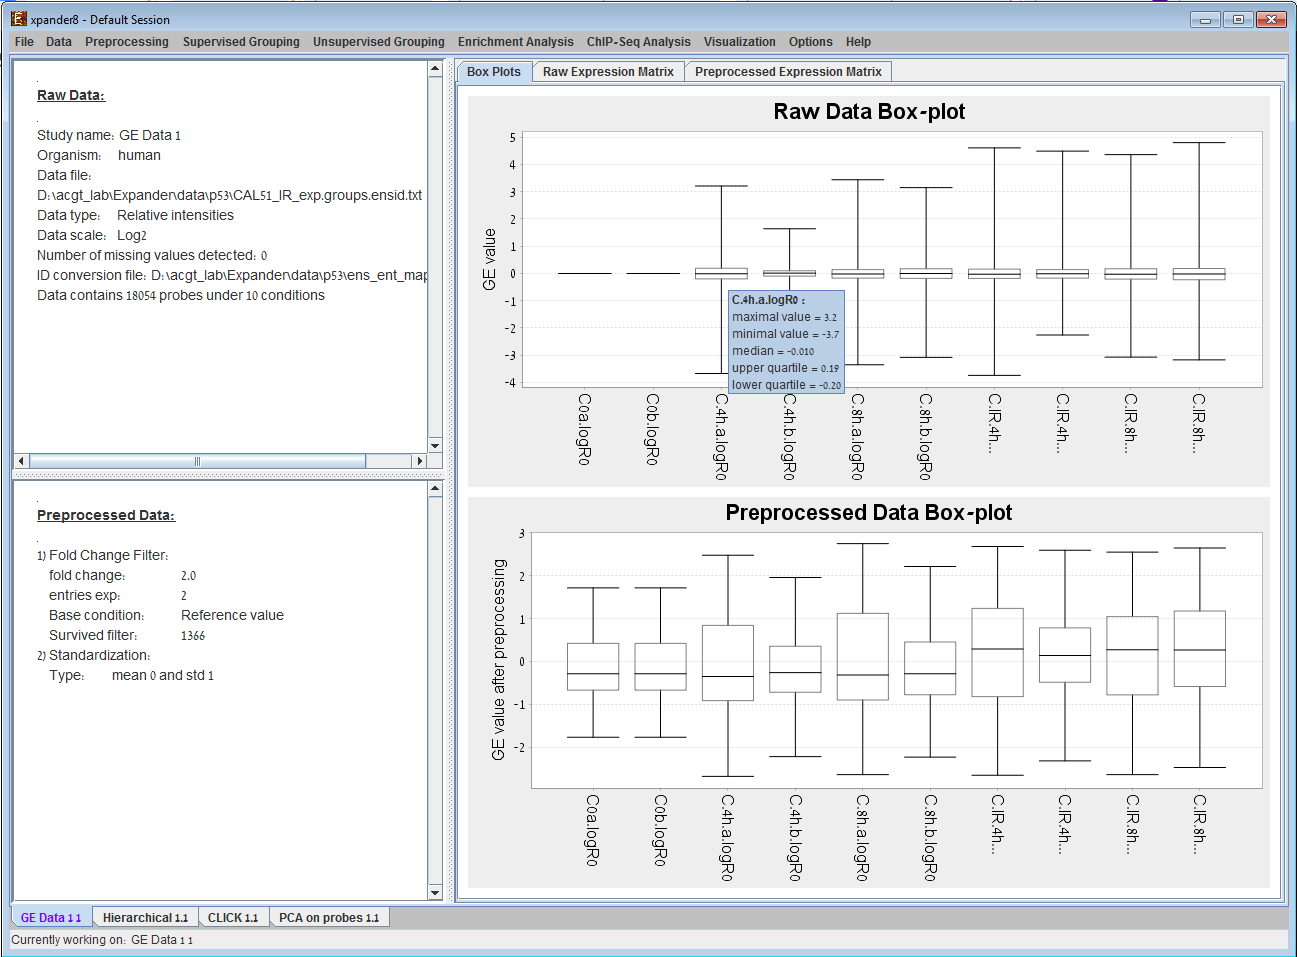
We present here some examples of data-analysis and visualizations performed by EXPANDER version 3.2. Under each image, there is a paragraph explaining its contents. 1) GE data displays2) Hierarchical Clustering Dendrogram display 3) Principal Component Analysis (PCA) display 4) Clustering results display 5) Biclustering results display 6) Functional analysis results display 7) Promoter analysis results display 8) TF binding sites display (1A)
(1B)
Expression Data display provided by EXPANDER. (A). The Preprocessed Data Matrix tab is selected on the right panel. It displays for each probe and condition in the filtered data, the corresponding expression level (rendered to green-red color scale) after all preprocessing operations. (B). The Box Plots tab is selected on the right panel for the same dataset as in (A).
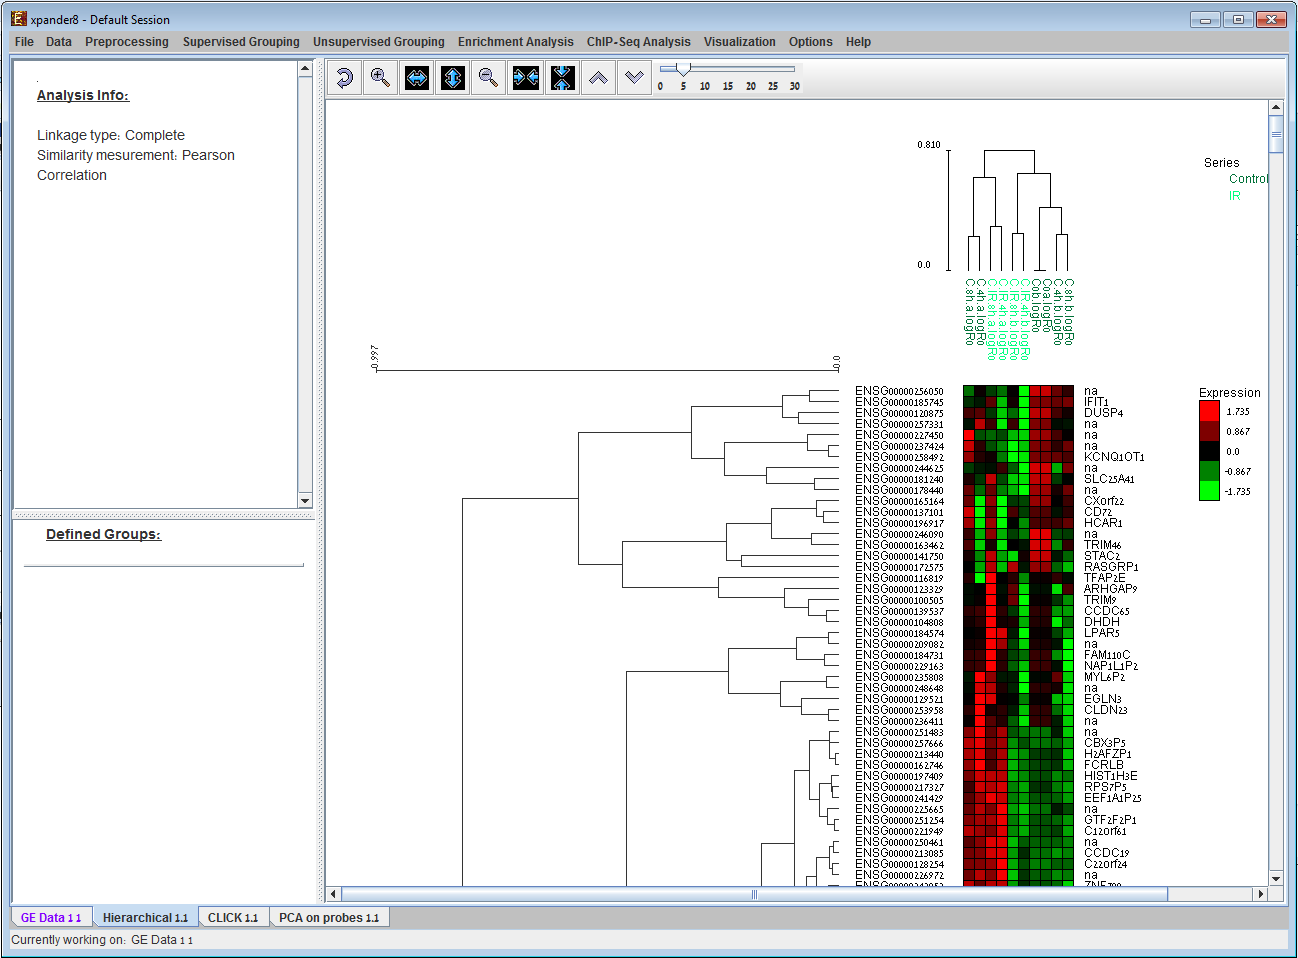
2) Hierarchical Clustering Dendrogram display:
The results of Hierarchical clustering performed by EXPANDER. Visualization
contains dendrogram trees displayed next to and above
the expression matrix. The rows and
columns in the matrix are ordered according to the hierarchical clustering dendrograms.
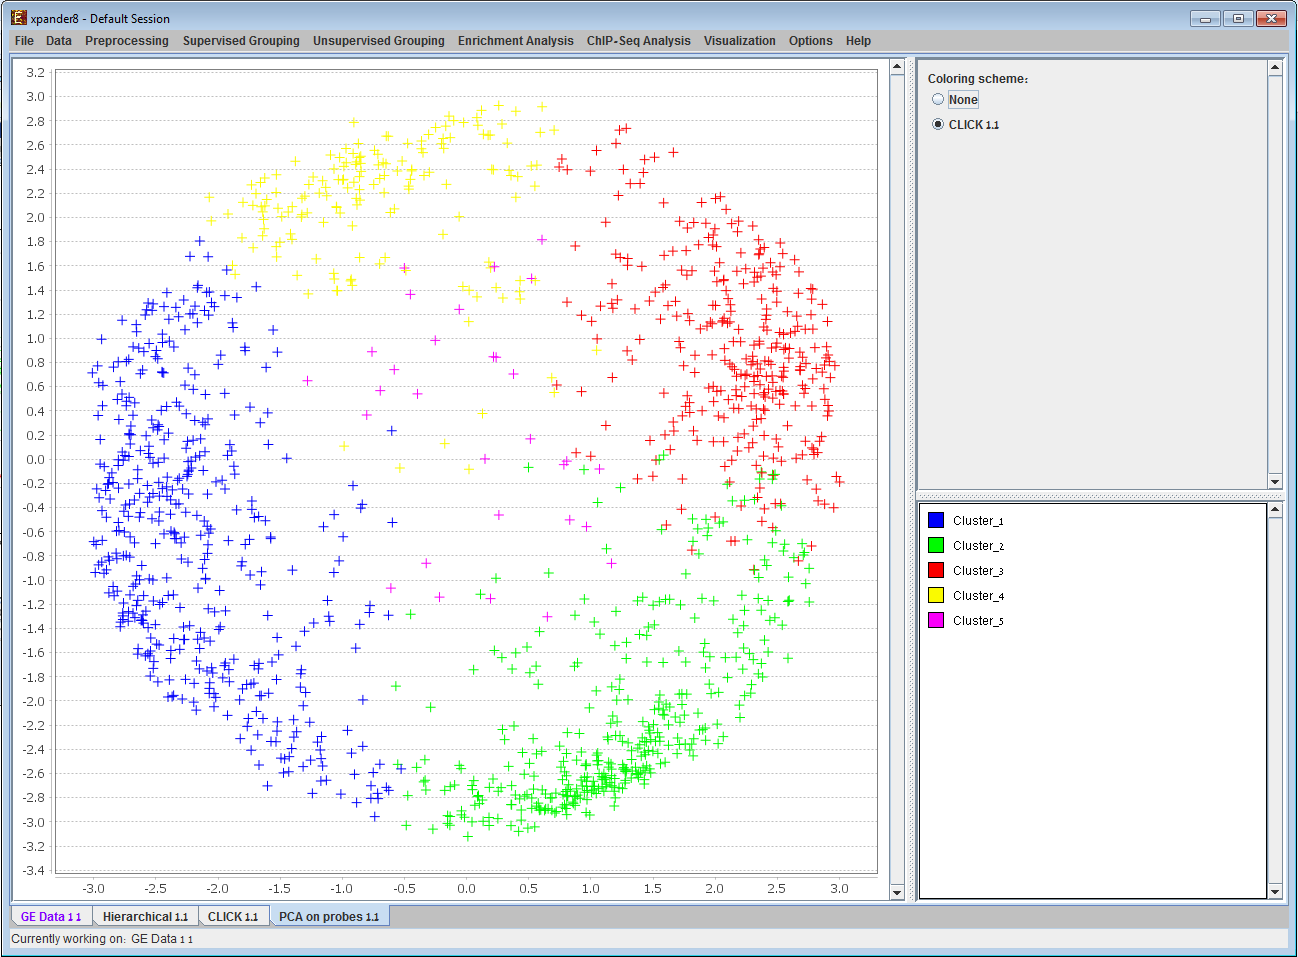
3) Principal Component Analysis (PCA) display:
PCA analysis result is displayed on an X-Y scatter plot. Probes with similar expression patterns are located close to each other in the plane. If clustering was performed, points can be coloured according to the cluster to which the corresponding probes are assigned.
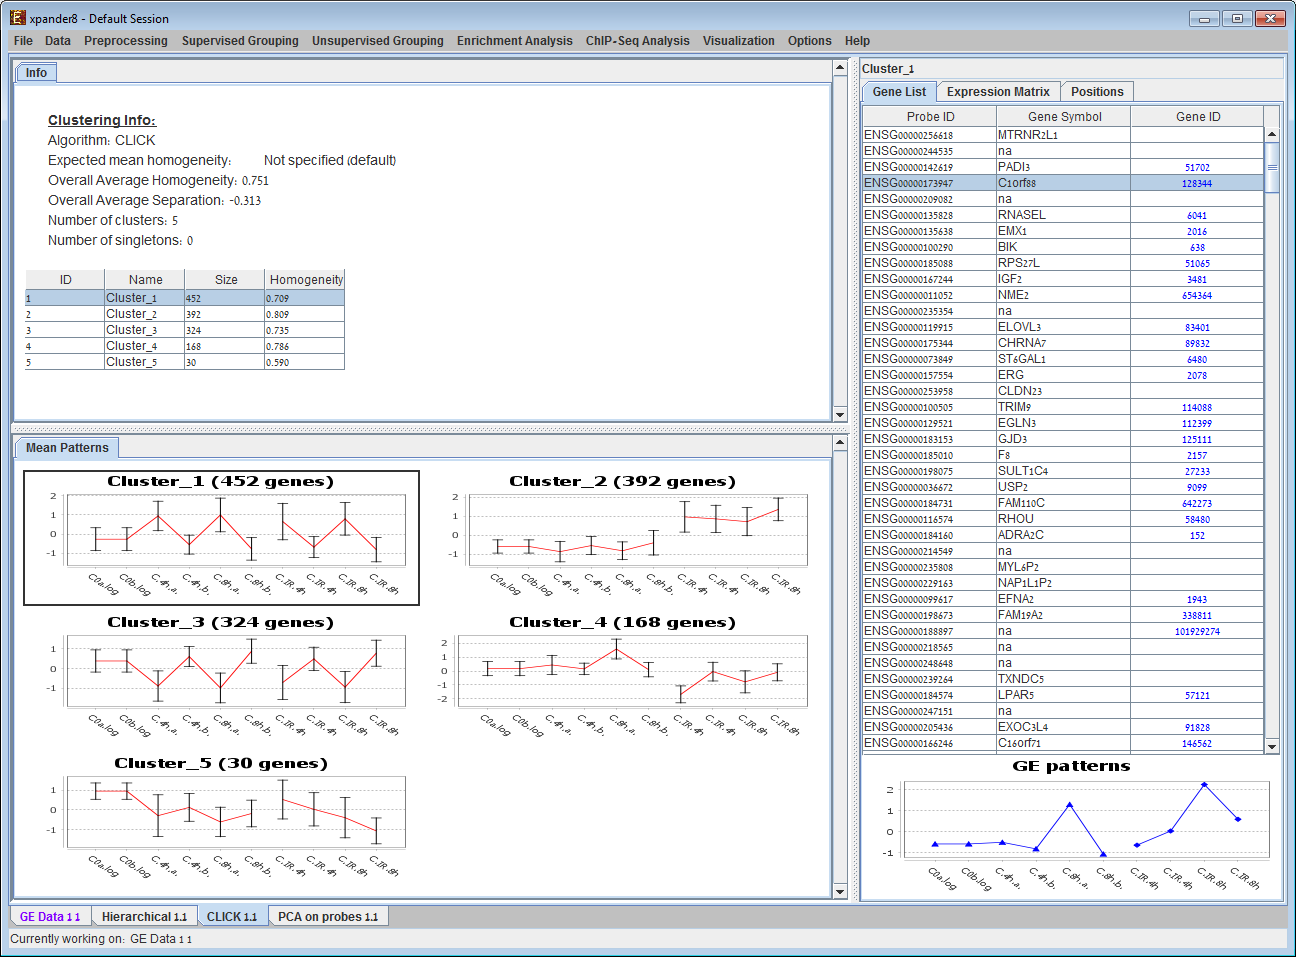
4) Clustering results display:
A display
automatically generated after operating a clustering algorithm. The panel on the
left contains information regarding the clustering algorithm, quality and number
& size of clusters. The central panel contains mean patterns of all clusters
(with error bars of size ±STD). Upon selecting a cluster (either from the
clusters table or from the central panel) its content is displayed on the right
panel, along with a matrix visualization of the corresponding probes (not
shown).
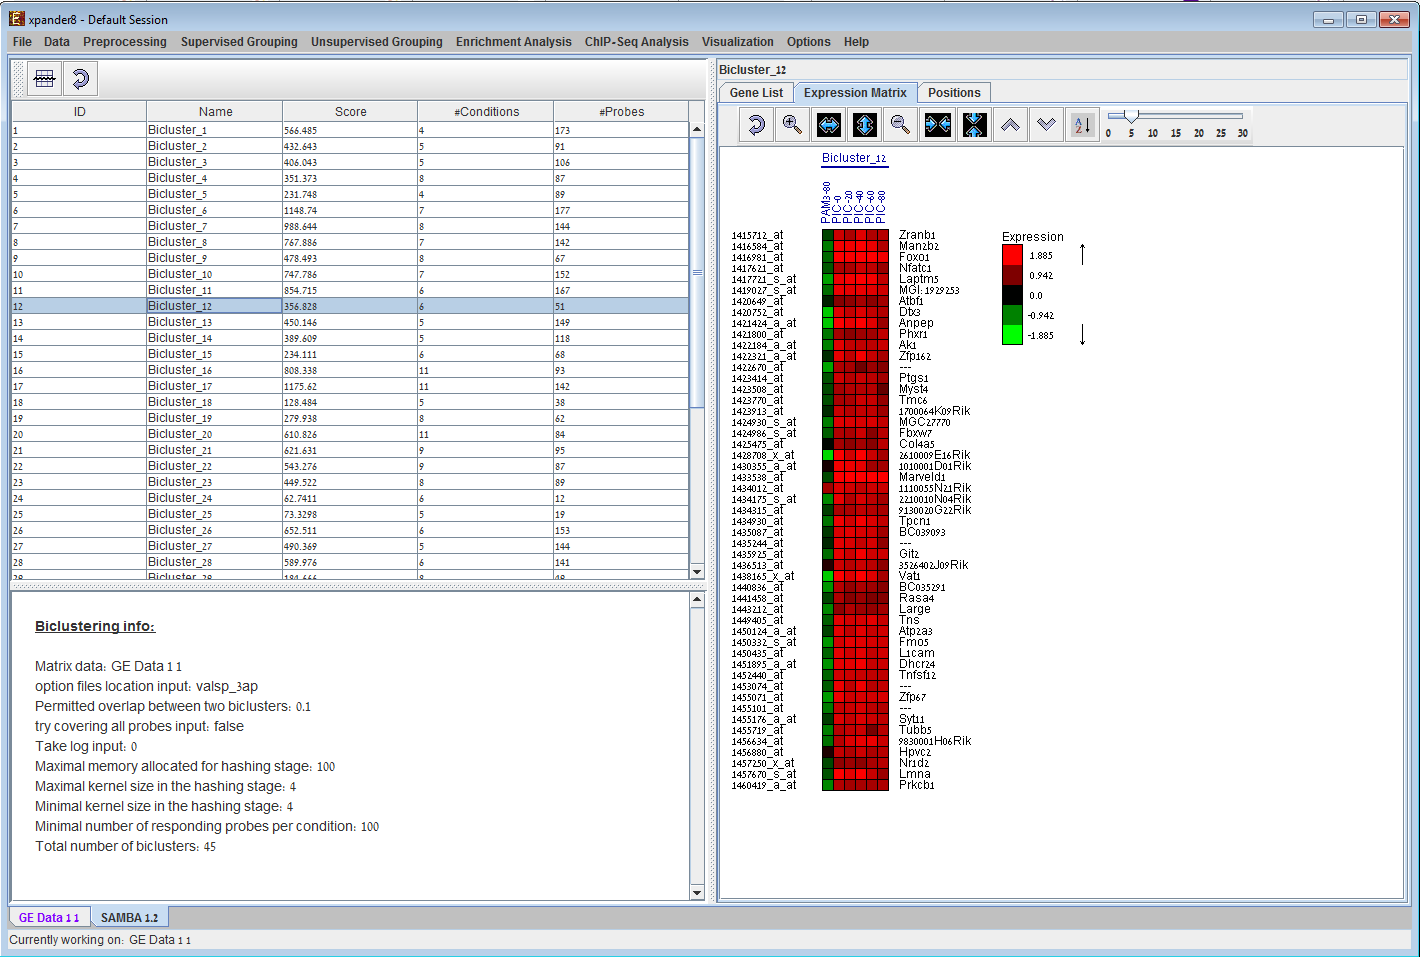
5) Biclustering results display:
Bi-clustering display in EXPANDER. Given a bi-clustering solution (can be calculated via EXPANDER) EXPANDER displays a table of all bi-clusters, which can be filtered and sorted according to the user's selection. Upon selecting a row in the table, the content of the bi-cluster is displayed in the panel on the right, using an expression matrix, as well as a list of probes and their patterns as in clustering solution (not shown here).
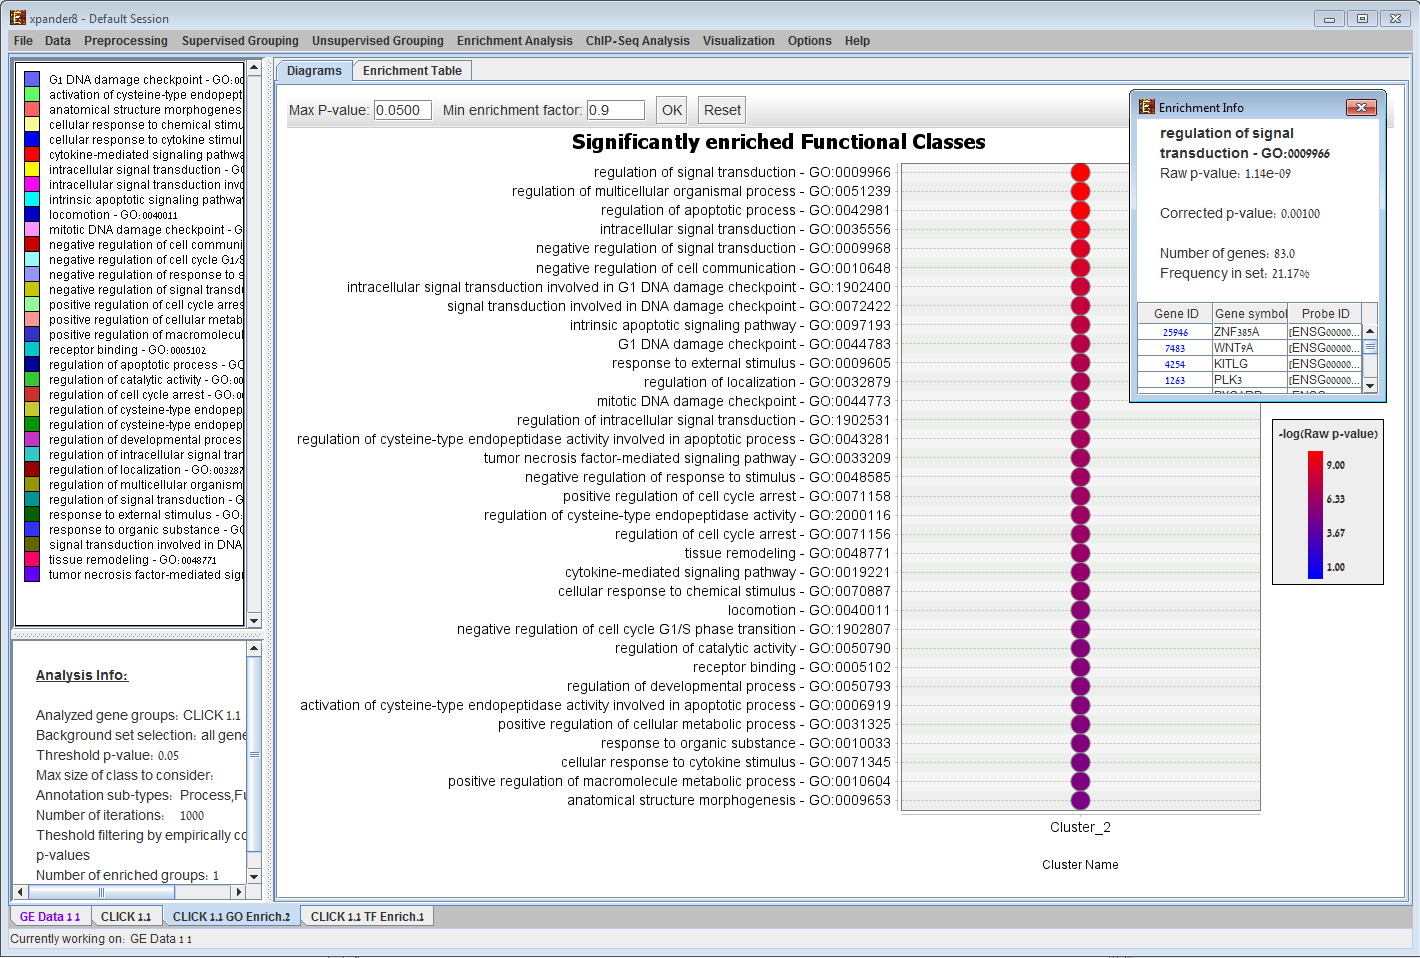
6) Functional analysis results display:
Functional enrichment in EXPANDER. Given a clustering/bi-clustering solution and a functional categorization of the genes, EXPANDER identifies clusters/bi-clusters that are significantly overpopulated with genes of specific functional categories. In the example, cluster #2 is enriched with genes in the `growth factor activity` category, while cluster #4 is enriched with genes in the `regulation of cellular physiological process`, `DNA binding`, `transcription factor activity`, `regulation of transcription/DNA dependent`, `negative regulation of cellular physiological process` and `sequence specific DNA binding` categories.
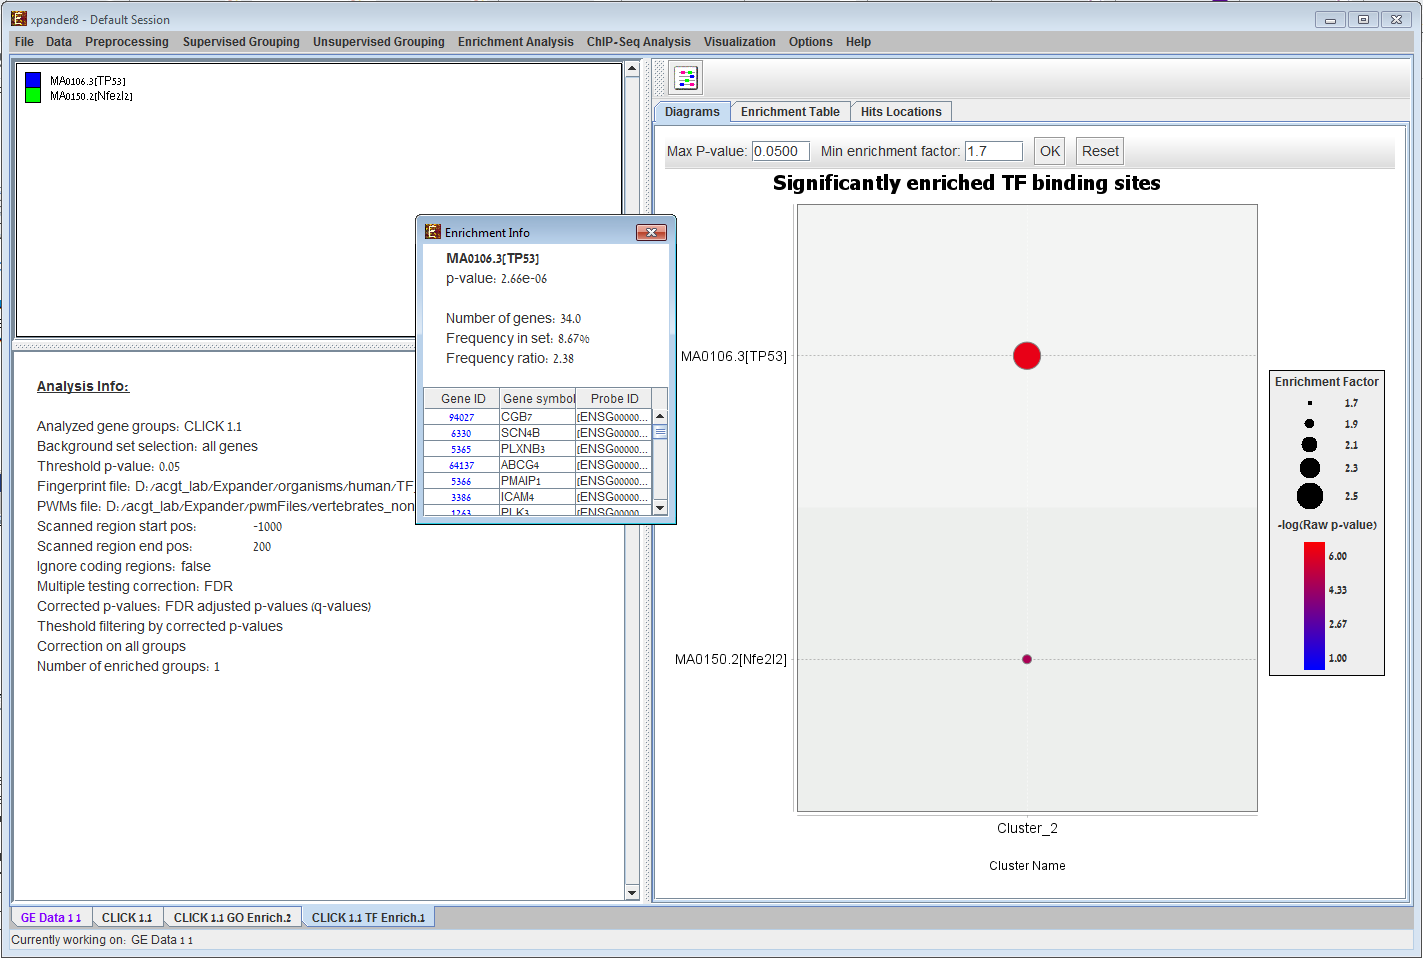
7) Promoter analysis results display:
Promoter analysis in EXPANDER. Given a clustering/bi-clustering solution and a TF binding site fingerprints file of an organism (supplied with EXPANDER for human, mouse, ray, fly, worm, and yeast ), EXPANDER uses the PRIMA software to identify clusters/bi-clusters that are significantly overpopulated with specific transcription factor binding sites. In the example, cluster #1 is enriched with genes that contain a binding site for `LEF1` and `MAZR` and cluster #4 is enriched with genes that contain a binding sites for `ATF`, `SRF` and `ZF5`.
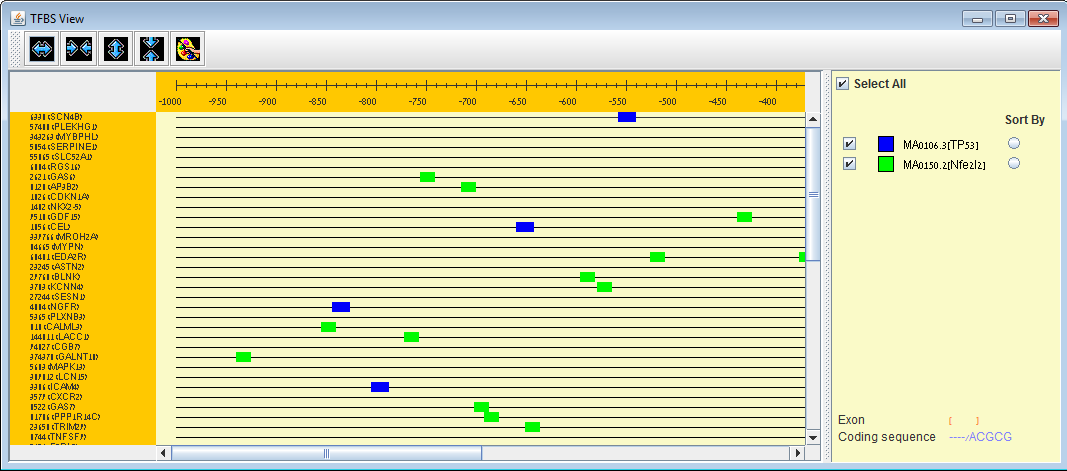
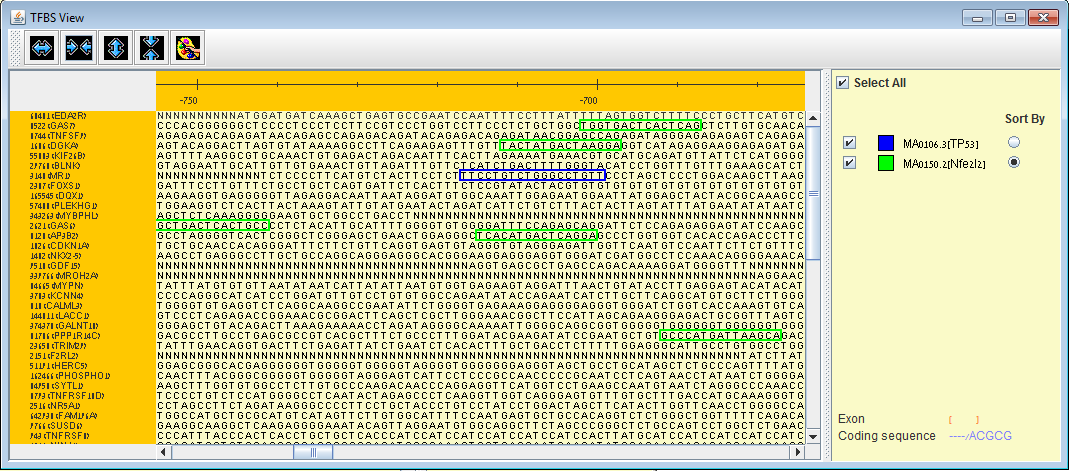
TFBS viewer can be opened via EXPANDER to view binding site locations of enriched TFs (i.e. TFs that were found to be enriched with a specific set of genes according to PRIMA) . Horizontal and vertical zooming are available up to sequence level (promoter sequences are provided for all supported organisms).
|