EXPANDER provides the following tools for the joint analysis after loading both ChIP-seq and gene expression data:
1) Examining
gene expression distribution within ChIP-Seq-associated genes: this is done via
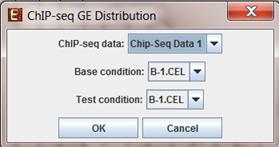
Visualization>>ChIP-seq GE distribution. Upon selecting this option, the
following dialog box will appear:
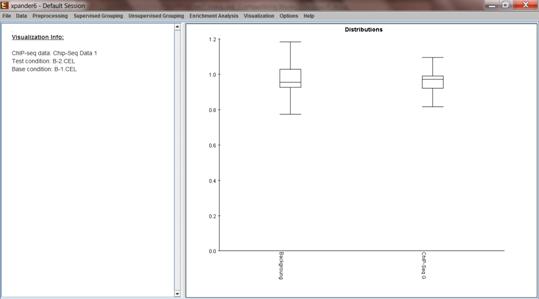
In the dialog box select the relevant ChIP-seq data set name, the base-condition and the test-condition, and click OK. A box plot showing the distribution of test-base GE ratios will be displayed for the set of chip-seq genes (right) and the rest of the genes in the gene-expression data set (left).
2) Extracting a grouping solution from chIP-seq-gene-groups intersection: this is done via Supervised Grouping >> ChIP-Seq Intersection. Upon selecting this option the following dialog box is displayed:
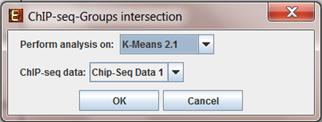
In the dialog box select the relevant grouping solution and ChIP-seq data set name, and click OK. A grouping solution visualization tab will be added to the main window. It will contain a gene-group for each non-empty intersection between a gene-group in the original solution and the chIP-Seq genes. Visualization is similar to clustering visualization.