À Promoter Analysis û PRIMA, AMADEUS
À Location Enrichment Analysis
À miRNA Targets Enrichment Analysis
À áChIP-Seq Enrichment Analysis
À Network Based Enrichment Analysis
À Gene Set Enrichment Analysis (GSEA)
The following analysis can be performed on gene sets, clusters, biclusters, network based modules, similarity based groups, or the filtered dataset (the analyzed set of probes as one set). Before operating any of the enrichment analysis operation (not including the ôGeneral enrichment analysisö), the data files for the relevant organism should be downloaded. Download can be done by selecting Help >> Download Data for Organism. Upon starting a new session, automatic data download will be suggested if Expander did not detect data for relevant organism.
This tool performs basic statistical analysis on the distribution of functions of genes within each cluster. The functions of the genes are determined according to annotation files (GO), which can be downloaded from the EXPANDER download page (see the Supplied Files section). To perform this analysis, Expander utilizes the TANGO software, which performs hyper-geometric enrichment tests and corrects for multiple testing by bootstrapping and estimating the empirical p-value distribution for the evaluated sets.á
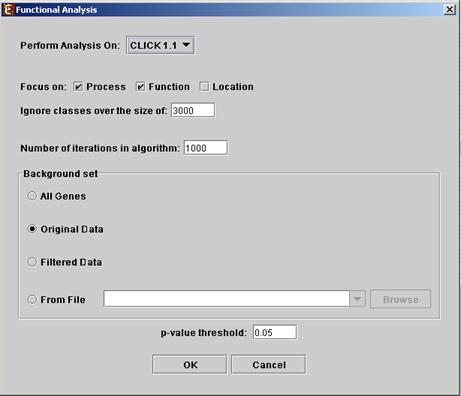
Before operating functional analysis the annotation files for the relevant organism should be downloaded from the download page (more details at introduction of Group_Analysis Tools). To perform the analysis, select Enrichment Analysis >> Functional Analysisá >> TANGO. The following dialog box will appear:á
The following table specifies the different
parameters that can be set via this dialog box:
á
|
Field |
Description |
|
Perform analysis on |
The grouping solution on which the analysis will be performed. |
|
Include back nodes |
Include genes that are part of the module' but not included in the GE data (Relevant only if the analysis is performed on modules, detected by network based algorithm) |
|
Focus on |
Can be used to select annotation subtypes that are of interest (Process, Function and Location). And the analysis will focus on these types only. |
|
Ignore classes over the size of |
This parameter states the level in the GO tree at which annotations are too general (class size indicates how general it is) and are thus no longer interesting. |
|
Number of iterations in algorithm |
The number of random sampling performed by the algorithm. Increasing this parameter, will increase runtime and will provide higher resolution on corrected p-Values. I.e., corrected p-Values will range between 1/<#iterations> and 1. |
|
Background set |
Determines the set of genes that will be used as background in the analysis. Options are: all genes (of the relevant organism), original input data, filtered data or background set from file (see the Files Format section for details regarding the format of an external background set). |
|
Corrected p-value threshold |
A functional class will be considered significantly enriched in a cluster/bicluster if its corrected p-value is lower than this threshold. The value in this field should be at least 1/1000, since the TANGO algorithm performs 1000 bootstraps in order to estimate the corrected p-value. |
Upon clicking æOKÆ in the dialog box, the TANGO algorithm is operated.
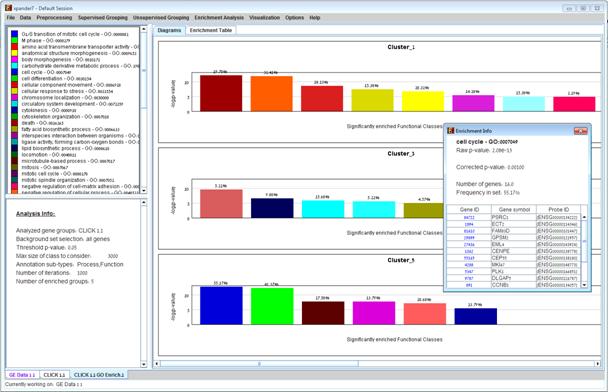
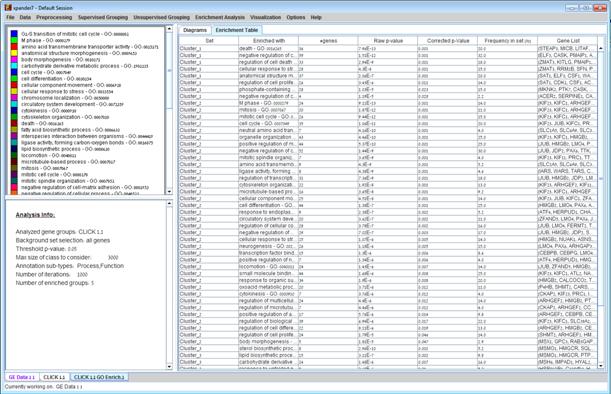
After functional analysis is performed a functional analysis solution visualization tab is added to the main window. It contains general information regarding the analysis, a sort-able table holding all detected enrichments (set ID, functional class, p-value, etc.) and a multi-histogram panel along with a color index (mapping each color to a corresponding functional class). The multi-histogram panel contains one histogram for each probe/gene set/group in which enrichment has been detected. Each histogram contains a column for each significant (more frequent than would be expected by random) functional class. The definition of significant depends on the userÆs selection of threshold p-value i.e., a functional class is considered significantly enriched in a cluster/bicluster if its corrected p-value is lower than the preset threshold p-value.
The height of the column is proportional to the significance of this enrichment (i.e. height = -log(raw p-value)). The frequency in set (frequency of genes of a functional class within the examined set, in %) is written on top of the column.á Upon clicking on a column, a dialog box is displayed containing the class name, raw p-value, corrected p-value, and a list of the genes in the cluster/bi-cluster that belong to the class. Upon clicking on one of the gene Ids in the table, a relevant web page with information regarding this gene is displayed. The display tool tip shows the cluster number, size and homogeneity.
Annotation files are currently supplied with EXPANDER for yeast, human, mouse, rat, fly, zebrafish, c-elegans, Arabidopsis, chicken and E. coli, and are updated on a regular basis (for more information, refer to the Supplied Files section).
The results of this analysis can be exported to a text file by selecting File>>Export to text when the corresponding view is the selected tab OR by using the File>>Save All option, which will export all solutions within a session to text and image files.
This tool identifies TFs whose binding sites are significantly over-represented in a given set of promoters (i.e. cluster or bicluster). To perform this analysis Expander utilizes the PRIMA (PRomoter Integration in Microarray Analysis) software which performs a statistical analysis on the distribution of transcription factor motifs in the promoters of genes within each cluster or bicluster. To achieve this, PRIMA uses preprocessed TF fingerprint files, which can be downloaded from the EXPANDER download-page (see the Supplied Files section), and are updated on a regular basis.á For details regarding the PRIMA software see the References section.
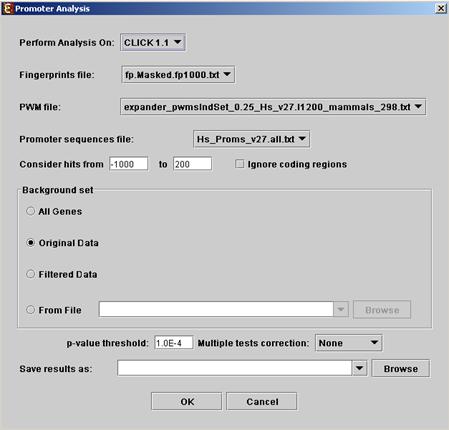
Before operating promoter analysis, the TF fingerprint file for the relevant organism should be downloaded from the download page (more details at introduction of Enrichment Analysis Tools). To perform the analysis, select Enrichment Analysis >> Promoter Analysis >> PRIMA. The following dialog box will appear:
 á
á
The following table specifies the different parameters that can be set via this dialog box:
|
Field |
Description |
|
Perform analysis on |
The grouping solution on which the analysis will be performed. |
|
Include back nodes |
Include genes that are part of the module' but not included in the GE data (Relevant only if the analysis is performed on modules, detected by network based algorithm) |
|
Fingerprints file |
Automatically set according to the selection of the organism. |
|
PWM file |
Automatically set according to the selection of the organism. |
|
Promoter sequences file |
Contains the gene sequences that are used for the TF binding sites display. Automatically set according to the selection of the organism. |
|
Hits range |
Determines which regions of the gene are to be analyzed.á The possible range depends on the investigated organism (i.e. on the information provided in the TF fingerprint files), and is specified in the Supplied Files section. |
|
Background set |
Determines the set of genes that will be used as background in the analysis. Options are: all genes (of the relevant organism), original input data, filtered data or background set from file (see the Files Format section for details regarding the format of an external background set). |
|
Threshold p-value |
A TF's binding site will be considered significantly enriched in a cluster if its corrected p-value is lower than this threshold. |
|
Multiple tests correction |
Can be set to Bonferroni or None (when set to Bonferroni the corrected p-values are the ones that are compared to the threshold p-value). |
|
Save results as |
When filled, the program results are saved in stated txt file. |
After promoter analysis is performed, a promoter analysis solution visualization tab is added to the main window. It contains general information regarding the analysis, a sort-able table holding all detected enrichments (set ID, TF binding site, p-value, etc.) and a multi-histogram panel along with a color index (mapping each color to a corresponding TF binding site). The multi-histogram panel contains one histogram for each probe/gene set/group in which enrichment has been detected. Each histogram contains a column for each significant (more frequent than would be expected by random) TF binding site. The definition of significant depends on the userÆs selection of threshold p-value. i.e., a TF binding site is considered significantly enriched in a cluster/bicluster if its corrected p-value is lower than the preset threshold p-value.
The height of a column is proportional to the significance of this enrichment (i.e. height = -log(p-value)), and the frequency ratio (frequency in set divided by frequency in background) is written on top of the column. Upon clicking on a column, a dialog box is displayed containing:
TF accession number in TRANSFAC DB [TF name], p-value, % of covered promoters in cluster, relative frequency (frequency in cluster divided by frequency in background set) and a list of the genes in the cluster which contain the motif in their promoters. Upon clicking on one of the gene Ids in the table, a relevant web page with information regarding this gene is displayed. The display tool tip shows the cluster number, size and homogeneity.
ááááááá 

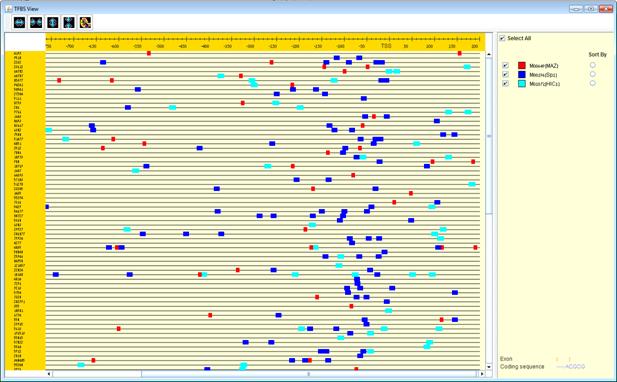
After performing promoter analysis, TF
binding sites can be viewed by selecting Enrichment Analysis >>
Promoter Analysis >> View Binding Sites OR by pressing the toolbar
button (![]() ).
After selecting the gene group (cluster/bi-cluster etc.) to be viewed, a
separate frame is displayed, containing a line to represent each of the genes
in the group, and a colored rectangle, to represent each binding site. A color
index appears on the right, mapping each color to the corresponding TF (PWM). A
check box next to each of the entries in the color index allows hiding any of the
PWMs, and a radio button next to each of the entries in the color index allows
sorting the genes in the display according to the number of hits of the
corresponding TF. The toolbar contains tools for vertical and horizontal
zooming. If a sequence file had been selected via the promoter analysis input
dialog, the actual sequence will be displayed when the zoom factor (scale)
allows it.
).
After selecting the gene group (cluster/bi-cluster etc.) to be viewed, a
separate frame is displayed, containing a line to represent each of the genes
in the group, and a colored rectangle, to represent each binding site. A color
index appears on the right, mapping each color to the corresponding TF (PWM). A
check box next to each of the entries in the color index allows hiding any of the
PWMs, and a radio button next to each of the entries in the color index allows
sorting the genes in the display according to the number of hits of the
corresponding TF. The toolbar contains tools for vertical and horizontal
zooming. If a sequence file had been selected via the promoter analysis input
dialog, the actual sequence will be displayed when the zoom factor (scale)
allows it.
Another option for performing promoter analysis, is finding enriched de novo motifs using AMADEUS integrated software in Expander. Amadeus is a software for de novo motif discovery. It seeks for motifs which are enriched in a target set of genes compared to the background set. These sets can be extended to any kind of sequences (e.g., ChIP-Seq peaks).
In order to perform motifs enrichments analysis, select Enrichment Analysis >> Promoter Analysis >> AMADEUS.
The following dialog box will appear:
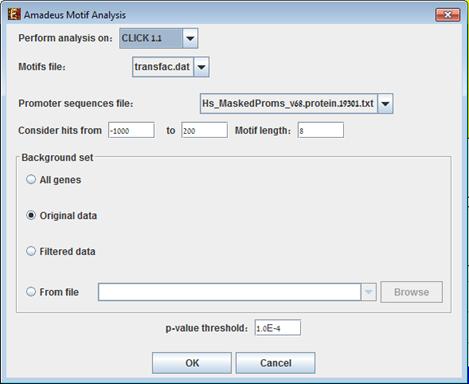
The following table specifies the different parameters that can be set via this dialog box:
|
Field |
Description |
|
Perform analysis on |
The grouping solution on which the analysis will be performed. |
|
Motifs file |
A matrix table of known motifs in TRANSFAC format. The automatic default is transfac.dat, a public release of TRANSFAC. |
|
Promoter sequences file |
Contains the promoter sequences in fasta format. Automatically set according to the selection of the organism. Can be set to any set of sequences (e.g., ChIP-Seq peaks). |
|
Motif Length |
The length of the motif to be searched for. |
|
Hits range |
Determines which sections of the sequences are analyzed.á The range depends on the organism (i.e. the average length of a promoter sequence, on the information provided in the TF fingerprint files), and is specified in the Supplied Files section. It can be set manually. |
|
Background set |
Determines the set of genes, whose promoter sequences áwill be used as background in the analysis. Options are: all genes (of the relevant organism), original input data, áfiltered data or background set from file (see the Files Format section for details regarding the format of an external background set). |
|
P-value threshold |
A motif will be considered
significantly enriched in a cluster if its corrected p-value is lower than
this threshold. |
After AMDEUS analysis is performed, an Amadeus motif solution visualization tab is added to the main window. It contains general information regarding the analysis, a sort-able table holding all detected enrichments (set ID, Motif binding site, p-value, etc.) and a multi-histogram panel along with a color index (mapping each color to a corresponding Motif binding site). The multi-histogram panel contains one histogram for each probe/gene set/group in which enrichment has been detected. Each histogram contains a column for each significant (more frequent than would be expected in the background set) motif binding site. The significance depends on the userÆs selection of p-value threshold. i.e., a motif binding site is considered significantly enriched in a cluster/bicluster if its corrected p-value is lower than the preset p-value threshold.
The height of a column is proportional to the significance of this enrichment (i.e. height = -log(p-value)), and the frequency ratio (frequency in the target set divided by frequency in the background set) is written on top of the column. Upon clicking on a column, a dialog box is displayed containing:
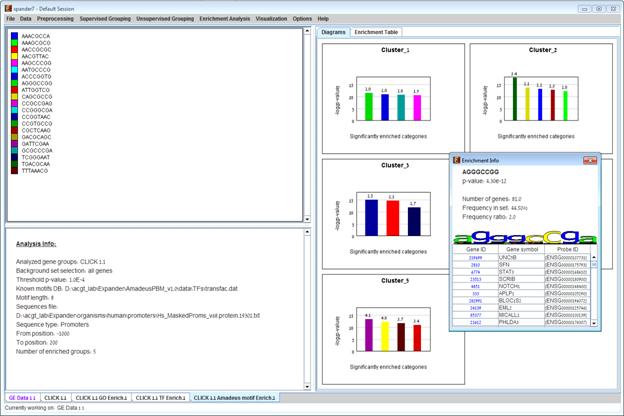
motif binding site, p-value, % of promoters containing the motif in the cluster, relative frequency (frequency in the cluster divided by frequency in background set), motif logo created from position weight matrix and a list of the genes in the cluster which contain the motif in their promoters. Upon clicking on one of the gene ids in the table, a relevant web page with information regarding this gene is displayed. The display tool tip shows the cluster number, size and homogeneity.
TF motif fingerprint files and promoter sequence files are currently supplied with EXPANDER for yeast, human, mouse, rat, fly, zebrafish, c-elegans, arabidopsis and chicken, and are updated on a regular basis (for more information, refer to the Supplied Files section).
The results of this analysis can be exported to a text by selecting File>>Export to text when the corresponding view is the selected tab.
This tool performs basic statistical analysis on the distribution of chromosomal locations of genes within each group. The locations of the genes are specified in organism-specific data files, which can be downloaded from the EXPANDER download-page (see the Supplied Files section).á
Before operating location analysis, the location data for the relevant organism should be downloaded from the download page (more details at introduction of Enrichment Analysis Tools).á In this analysis, hyper-geometric enrichment tests are performed, and the results can be (if requested) corrected for multiple testing using the Bonferroni correction.á
To perform the analysis, select Enrichment Analysis >> Location Analysis >> Detect Enrichment. The following dialog box will appear:á
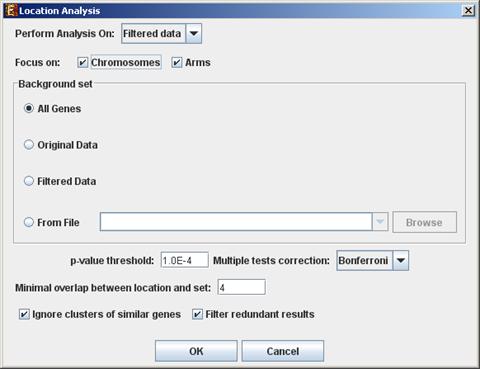
The following table specifies the different
parameters that can be set via this dialog box:
á
|
Field |
Description |
|
Perform analysis on |
The grouping solution on which the analysis will be performed. |
|
Include back nodes |
Include genes that are part of the module' but not included in the GE data (Relevant only if the analysis is performed on modules, detected by network based algorithm) |
|
Focus on (Chromosomes, Arms*, Bands*)
|
Location types to perform analysis on. |
|
Background set |
Determines the set of genes that will be used as background in the analysis. Options are: all genes (of the relevant organism), original input data, filtered data or background set from file (see the Files Format section for details regarding the format of an external background set). |
|
áp-value threshold |
A category/attribute will be considered significantly enriched in a cluster/bicluster if its corrected p-value is lower than this threshold. |
|
Multiple tests correction |
Can be set to Bonferroni or None (when set to Bonferroni the corrected p-values are the ones that are compared to the threshold p-value). |
|
Minimal overlap between category and set |
The minimal number of genes from a group (cluster/bi-cluster/module etc.) expected to be categorized/attributed by an attribute in order for its enrichment to be accepted. |
|
Ignore clusters of similar genes* |
If selected, genes from known homology clusters are not included in the analysis. |
|
Filter redundant results |
If selected, the results are filtered, so that out of two enrichments of overlapping areas in the same group, only one is selected (the most significant one). |
* If relevant data exists
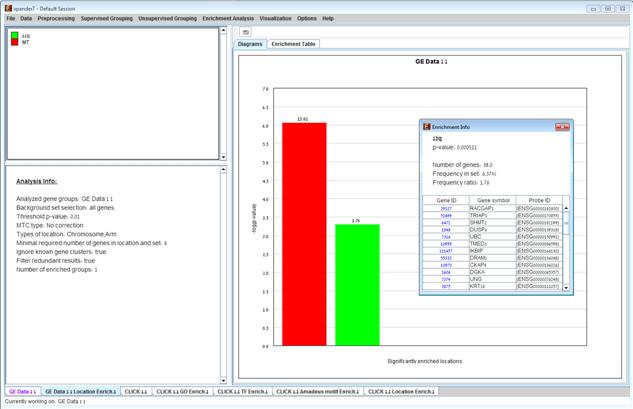
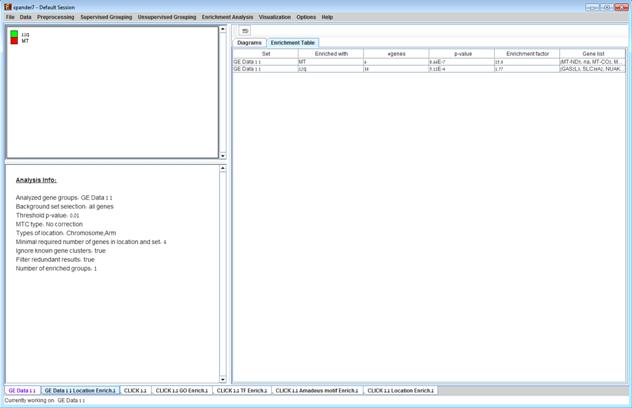
After the analysis is performed an enrichment analysis solution visualization tab is added to the main window. It contains general information regarding the analysis, a sort-able table holding all detected enrichments (set ID, enrichment category, p-value, etc.) and a multi-histogram panel along with a color index (mapping each color to a corresponding location). The multi-histogram panel contains one histogram for each probe/gene group in which enrichment has been detected. Each histogram contains a column for each significant (more frequent than would be expected by random) location. The definition of significant depends on the userÆs selection of threshold p-value i.e., a category is considered significantly enriched in a cluster/bicluster if its corrected p-value is lower than the preset threshold p-value.
The height of the column is proportional to the significance of this enrichment (i.e. height = -log(raw p-value)), and the frequency ratio (frequency in set divided by frequency in background) is written on top of the column. Upon clicking on a column, a dialog box is displayed containing the location, corrected p-value, and a list of the genes in the group that are mapped to this location. Upon clicking on one of the gene Ids in the table, a relevant web page with information regarding this gene is displayed.
After performing location enrichment
analysis, the locations can be viewed by selecting Enrichment Analysis
>> Location Analysis >> View Locations OR by pressing the
toolbar button (![]() ). After selecting the gene group
(cluster/bi-cluster etc.) to be viewed, a separate frame is displayed,
containing an image of all chromosomes on which the positions of the genes in
the group are marked. If the gene is located on an area that was identified to
be enriched in that group, its position is marked in the same color to this
area the enrichment results histogram.
). After selecting the gene group
(cluster/bi-cluster etc.) to be viewed, a separate frame is displayed,
containing an image of all chromosomes on which the positions of the genes in
the group are marked. If the gene is located on an area that was identified to
be enriched in that group, its position is marked in the same color to this
area the enrichment results histogram.

The results of this analysis can be exported to a text file by selecting File>>Export to text when the corresponding view is the selected tab OR by using the File>>Save All option, which will export all solutions within a session to text and image files.
This tool performs a statistical analysis on the distribution of miRNA target gene within each group. The miRNA targets information is supplied in organism-specific data files, which can be downloaded from the EXPANDER download-page (see the Supplied Files section). For this analysis, Expander utilizes the FAME algorithm, which performs empirical tests using a sampling technique (random permutations) to estimate the empirical p-value distribution for the evaluated groups.á This is done while accounting for biases in the 3' UTR sequences
Before operating miRNA enrichment analysis, the location data for the relevant organism should be downloaded from the download page (more details at introduction of Enrichment Analysis Tools).á In this analysis, hyper-geometric enrichment tests are performed, and the results can be (if requested) corrected for multiple testing using the Bonferroni correction.á
To perform the analysis, select Enrichment Analysis >> miRNA Analysis >> FAME. The following dialog box will appear:á

The following table specifies the different
parameters that can be set via this dialog box:
á
|
Field |
Description |
|
Perform analysis on |
The grouping solution on which the analysis will be performed. |
|
Include back nodes |
Include genes that are part of the module' but not included in the GE data (Relevant only if the analysis is performed on modules, detected by network based algorithm) |
|
Enrichment Direction
|
Allows to choose between searching for over-represented targets and searching for under-represented targets. |
|
Use context scores |
If context scores are used, FAME will assign a higher weight to miRNA-gene pairs for which at least one target site has a high maximal context score (see References section for further details). |
|
Number of Iterations |
The number of random permutations used for the empirical tests. |
|
Background set |
Determines the set of genes that will be used as background in the analysis. Options are: all genes (of the relevant organism), original input data, filtered data or background set from file (see the Files Format section for details regarding the format of an external background set). |
|
áp-value threshold |
A category/attribute will be considered significantly enriched in a cluster/bicluster if its corrected p-value is lower than this threshold. |
|
Multiple tests correction |
Can be set to FDR, Bonferroni or None (when set to Bonferroni/FDR the corrected p-values are the ones that are compared to the threshold p-value). |
|
Minimal overlap between targets and group |
The minimal number of genes from a group (cluster/bi-cluster/module etc.) expected to be categorized/attributed by an attribute in order for its enrichment to be accepted. |
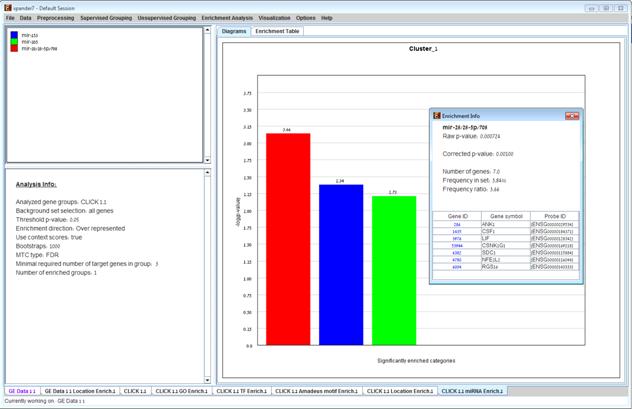
After the analysis is performed an enrichment analysis solution visualization tab is added to the main window. It contains general information regarding the analysis, a sort-able table holding all detected enrichments (group name, enriched miRNA target, p-value, etc.) and a multi-histogram panel along with a color index (mapping each color to a corresponding miRNA). The multi-histogram panel contains one histogram for each probe/gene group in which enrichment has been detected. Each histogram contains a column for each significant (more frequent than would be expected by random) miRNA target. The definition of significant depends on the userÆs selection of threshold p-value i.e., an mRNA target is considered significantly enriched in a group of genes if its corrected p-value is lower than the selected threshold p-value.
The height of the column is proportional to the significance of this enrichment (i.e. height = -log(raw p-value)), and the frequency ratio (frequency in set divided by frequency in background) is written on top of the column. Upon clicking on a column, a dialog box is displayed containing the miRNA name, corrected p-value, and a list of the genes in the group that are mapped to this location. Upon clicking on one of the gene Ids in the table, a relevant web page with information regarding this gene is displayed.
The results of this analysis can be exported to a text file by selecting File>>Export to text when the corresponding view is the selected tab. OR by using the File>>Save All option, which will export all solutions within a session to text and image files.
This tool performs a statistical analysis to test for significant representation of the genes closest to ChIP-Seq data peaks within each group.
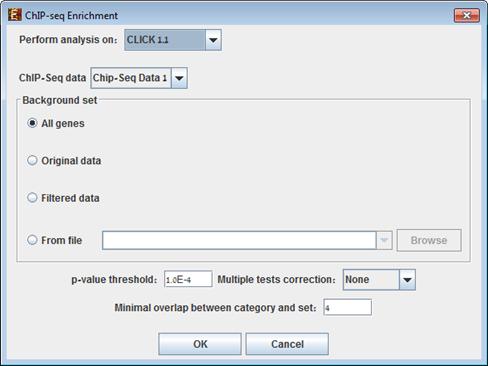
To perform the analysis, select Enrichment Analysis >> ChIP-Seq Enrichment. The following dialog box will appear:
The following table specifies the different
parameters that can be set via this dialog box:
á
|
Field |
Description |
|
Perform analysis on |
The grouping solution on which the analysis will be performed. |
|
Background set |
Determines the set of genes that will be used as background in the analysis. Options are: all protein coding genes (of the relevant organism), original input data, filtered data or background set from file (see the Files Format section for details regarding the format of an external background set). |
|
áp-value threshold |
ChIP-Seq representation will be considered significantly enriched in the pathway in a cluster/bicluster if its corrected p-value is lower than this threshold. |
|
Multiple tests correction |
Can be set to Bonferroni or None (when set to Bonferroni the corrected p-values are the ones that are compared to the threshold p-value). |
|
Minimal overlap between category and set |
The minimal number of genes from a cluster/bi-cluster expected to be part of the set of ChIP-Seq closest genes to peaks |
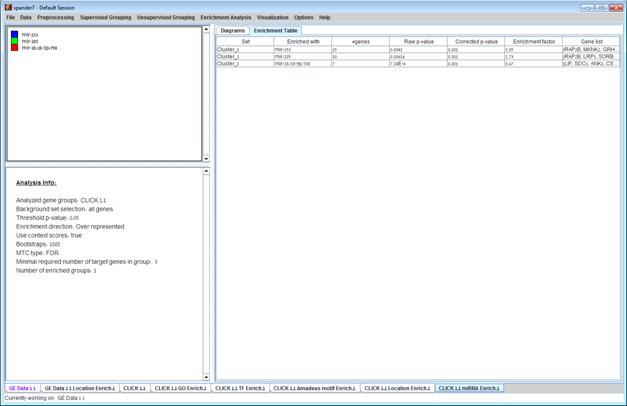
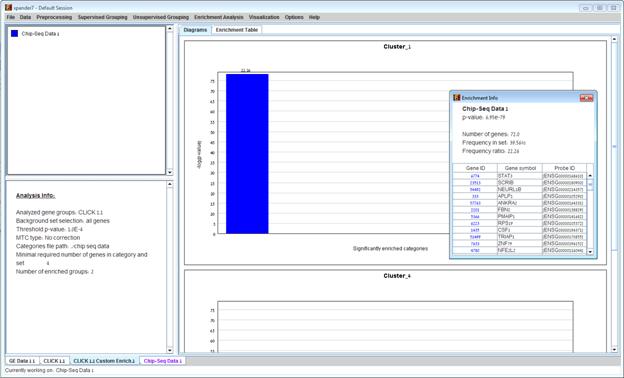
After the analysis is performed, an enrichment solution visualization tab is added to the main window. It contains general information about the analysis, a sorted table holding all detected enrichments (group name, name of enriched ChIP-Seq data, p-value, etc.) and a multi-histogram panel which contains one histogram for each probe/gene group in which enrichment has been detected. The definition of significant depends on the userÆs selection of threshold p-value i.e., a ChIP-Seq data-set is considered significantly enriched in a group of genes if its corrected p-value is lower than the selected threshold p-value.
The height of the column is proportional to the significance of this enrichment (i.e. height = -log (raw p-value)), and the frequency ratio (frequency in set divided by frequency in background) is written on top of the column. Upon clicking on a column, a dialog box is displayed containing the enrichment information, corrected p-value and a list of the genes in the group that are included in the corresponding ChIP-Seq data. Upon clicking on one of the gene Ids in the table, a relevant web page with information regarding this gene is displayed.
This tool performs a statistical analysis on the representation of KEGG and WikiPathways pathway maps within each group. The KEGG and WikiPathways information is supplied in organism-specific data files, which can be downloaded from the EXPANDER download-page (see the Supplied Files section In this analysis, hyper-geometric enrichment tests are performed, and the results can be (if requested) corrected for multiple testing using the Bonferroni correction.á
To perform the analysis, select Enrichment Analysis >> Pathway Analysis >> KEGG or Enrichment Analysis >> Pathway Analysis >> WikiPathways . The following dialog box will appear:á

The following table specifies the different
parameters that can be set via this dialog box:
á
|
Field |
Description |
|
Perform analysis on |
The grouping solution on which the analysis will be performed. |
|
Background set |
Determines the set of genes that will be used as background in the analysis. Options are: all genes (of the relevant organism), original input data, filtered data or background set from file (see the Files Format section for details regarding the format of an external background set). |
|
áp-value threshold |
A category/attribute will be considered significantly enriched in the pathway in a cluster/bicluster if its corrected p-value is lower than this threshold. |
|
Multiple tests correction |
Can be set to Bonferroni or None (when set to Bonferroni the corrected p-values are the ones that are compared to the threshold p-value). |
|
Minimal overlap between category and set |
The minimal number of genes from a cluster/bi-cluster expected to be categorized/attributed by an attribute in order for its pathway analysis to be accepted. |
After the analysis was performed a Pathway analysis solution visualization tab is added to the main window. It contains general information about the analysis, a sorted table holding all detected pathways (group name, enriched pathway target, p-value, etc.) and multi-histogram panel along with a color index (mapping each color to a corresponding pathway).
The multi-histogram panel contains one histogram for each probe/gene group in which enrichment has been detected. Each histogram contains a column for each significant (more frequent than would be expected by random) pathway target. The definition of significant depends on the userÆs selection of threshold p-value i.e., a pathway target is considered significantly enriched in a group of genes if its corrected p-value is lower than the selected threshold p-value.
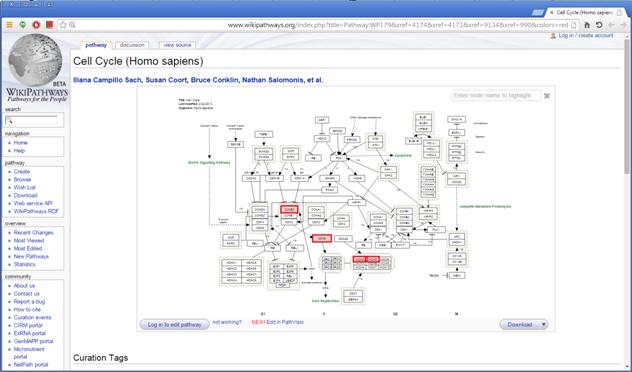
The height of the column is proportional to the significance of this enrichment (i.e. height = -log(raw p-value)), and the frequency ratio (frequency in set divided by frequency in background) is written on top of the column. Upon clicking on a column, a dialog box is displayed containing the pathway name, corrected p-value, link to the relevant pathway map web page, and a list of the genes in the group that are included in the corresponding pathway. Upon clicking on one of the gene Ids in the table, a relevant web page with information regarding this gene is displayed.


Upon clicking on the link to the pathway map web page, the web browser displays the page with the relevant genes highlighted in it.
The results of this analysis can be exported to a text file by selecting File>>Export to text when the corresponding view is the selected tab. OR by using the File>>Save All option, which will export all solutions within a session to text and image files.
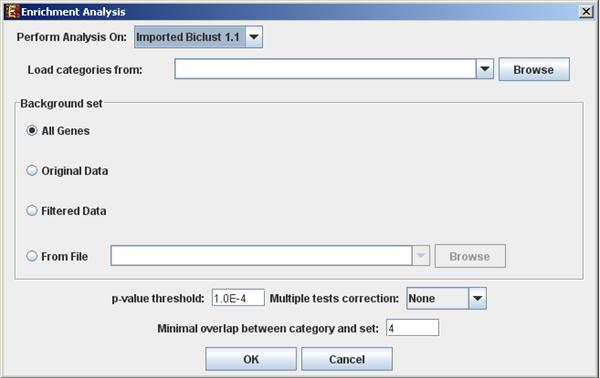
This tool performs basic statistical analysis on the distribution of categories/attributes of genes within each group. The categories/attributes of the genes are to be determined by the user and imported as a text (for details regarding the required format, see the File Formats section). In this analysis, hyper-geometric enrichment tests are performed, and the results can be (if requested) corrected for multiple testing using the Bonferroni correction.á
To perform the analysis, select Enrichment Analysis >> General Enrichment Analysis >> Detect Enrichment. The following dialog box will appear:á
The following table specifies the different
parameters that can be set via this dialog box:
á
|
Field |
Description |
|
Perform analysis on |
The grouping solution on which the analysis will be performed. |
|
Include back nodes |
Include genes that are part of the module' but not included in the GE data (Relevant only if the analysis is performed on modules, detected by network based algorithm) |
|
Load categories from |
Input field for the file path, holding the gene categories/attributes. |
|
Background set |
Determines the set of genes that will be used as background in the analysis. Options are: all genes (of the relevant organism), original input data, filtered data or background set from file (see the Files Format section for details regarding the format of an external background set). |
|
áp-value threshold |
A category/attribute will be considered significantly enriched in a cluster/bicluster if its corrected p-value is lower than this threshold. |
|
Multiple tests correction |
Can be set to Bonferroni or None (when set to Bonferroni the corrected p-values are the ones that are compared to the threshold p-value). |
|
Minimal overlap between category and set |
The minimal number of genes from a cluster/bi-cluster expected to be categorized/attributed by an attribute in order for its enrichment to be accepted. |
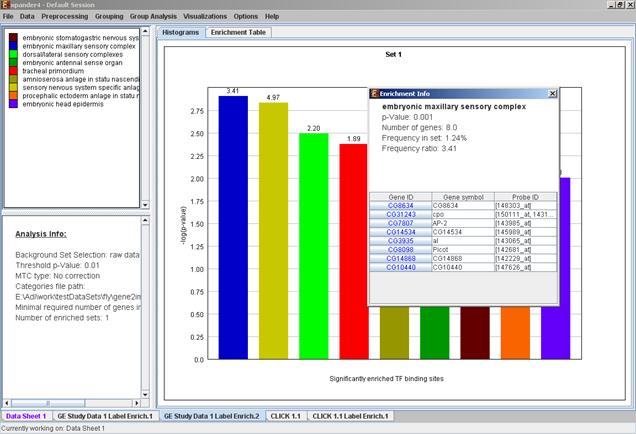
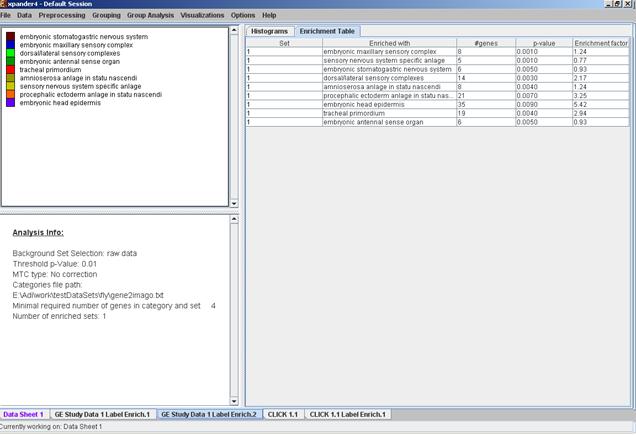
After the analysis is performed an enrichment analysis solution visualization tab is added to the main window. It contains general information regarding the analysis, a sort-able table holding all detected enrichments (set ID, enrichment category, p-value, etc.) and a multi-histogram panel along with a color index (mapping each color to a corresponding category). The multi-histogram panel contains one histogram for each probe/gene set/group in which enrichment has been detected. Each histogram contains a column for each significant (more frequent than would be expected by random) category. The definition of significant depends on the userÆs selection of threshold p-value i.e., a category is considered significantly enriched in a cluster/bicluster if its corrected p-value is lower than the preset threshold p-value.
The height of the column is proportional to the significance of this enrichment (i.e. height = -log(raw p-value)), and the frequency ratio (frequency in set divided by frequency in background) is written on top of the column. Upon clicking on a column, a dialog box is displayed containing the class name, corrected p-value, and a list of the genes in the cluster/bi-cluster that belong to the category. Upon clicking on one of the gene Ids in the table, a relevant web page with information regarding this gene is displayed. The display tool tip shows the cluster number, size and homogeneity.
The results of this analysis can be exported to a text file by selecting File>>Export to text when the corresponding view is the selected tab. OR by using the File>>Save All option, which will export all solutions within a session to text and image files.
This tool allows browsing through signaling data to view the sub-graphs that are induced by the analyzed gene groups. It also enables the user to search for statistical enrichment of these groups in highly curated signaling maps. To perform this task, Expander interfaces with the SPIKE software and database. For further information regarding the SPIKE software see the References section.
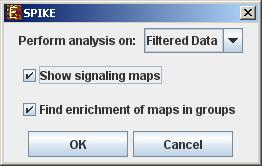
To perform the analysis on one/more of the gene groups defined in Expander (i.e. clusters, bi-clusters, modules, loaded gene sets or filtered data), select Enrichment Analysis >> Network >> SPIKE>>Gene Groups. The following dialog box will appear:
The following table specifies the different parameters that can be set via this dialog box:
|
Description |
|
|
Perform analysis on |
The grouping solution on which the analysis will be performed. |
|
Show signaling Maps |
For each group display regulatory data induced by the genes included in the group. |
|
Find enrichment of maps in groups |
For each group, search for signaling maps that are enriched with genes included in the group. |
Pressing OK in the dialog box will launch the SPIKE application. When operated for the first time, the launch takes a few minutes, since it has to build a local database. From this point on, please refer to page 12 in the SPIKE user manual.
SPIKE can also be operated on a sub-group of genes that is derived from an existing enrichment solution in Expander. I.e. a group of genes that has a common annotation that was found to be enriched by one of the enrichment áanalysis operations. In order to operate SPIKE on such a group, select: Enrichment Analysis>>Network>> SPIKE>>Enrichment Derived Sets.
GSEA (Subramanian et al 2005) considers experiments with genome-wide expression profiles from samples belonging to two classes. Genes are ranked based on the correlation between their expression and the differential expression between classes distinction or pre-ranked by the user.
Given an a priori defined set of genes S, the goal of GSEA is to determine whether the members of S are randomly distributed throughout the ranked list of genes (L) or primarily found at the top or bottom. It is expected that sets related to the phenotypic distinction will tend to show the latter distribution.
There are two key elements of the GSEA method in Expander:
Step 1: Calculation of an Enrichment Score. Enrichment score (ES) reflects the degree to which a set S is overrepresented at the extremes (top or bottom) of the entire ranked list L. The score is calculated by walking down the list L, increasing a running-sum statistic when we encounter a gene in S and decreasing it when we encounter genes not in S. The magnitude of the increment depends on the correlation of the gene with the phenotype. The enrichment score is the maximum deviation from zero encountered in the random walk. It corresponds to a weighted KolmogorovûSmirnov-like statistic.
Step 2: Estimation of Significance Level of ES. An estimation of the statistical significance (nominal P-value) of the ES is done by using an empirical phenotype-based permutation test procedure that preserves the complex correlation structure of the gene expression data. Specifically, the phenotype labels are permuted again and the ES of the gene set for the permuted data is re-computed, which generates a null distribution for the ES. If the user provided a pre-ranked list of genes then a random shuffling of the ranked list is done instead. The empirical, nominal P value of the observed ES is then calculated relative to this null distribution. Importantly, the permutation of class labels preserves gene-gene correlations and, thus, provides a more biologically reasonable assessment of significance than would be obtained by permuting genes.
There are 2 ways to perform GSEA:
1. GSEA on a pre-Ranked list of Genes without loading gene expression data
2. GSEA on a gene expression data
GSEA on a pre-Ranked list of Genes without loading gene expression data
To perform analysis on a pre-ranked list of genes, select File->New Session->Gene Ranking Analysis (GSEA).
The following dialog box will appear:
The following table specifies the different parameters that can be set via this dialog box:
|
Field |
Description |
|
Load ranks |
User pre-ranked list of genes file composed of two columns û first with genes and second with values |
|
Collection Group |
Can be chosen between: WikiPathways, KEGG, a gene-groups solution which was generated in the current session or an external file with gene sets* |
|
Rank Power (p) |
If p=0 then ES is reduced to standard KolmogorovûSmirnov statistic. If p=1then ES is a weighted KolmogorovûSmirnov-like statistic. |
|
Number of permutations |
For estimation of the Significance Level of ES |
Please refer to Results section in "GSEA on a gene expression data" to interpret the results.
ááááááááááá
GSEA on a gene expression data
To perform the analysis on the gene expression, select Enrichment Analysis >> run GSEAà
The following dialog box will appear:

The user can choose between "Matrix is gene based" (i.e each row should correspond to one gene, with probe ID = gene ID) or "Merge Probes by Gene IDs".
In case the user chose "Merge Probes by Gene IDs", a dialog box titled "Average Probes" will appear:
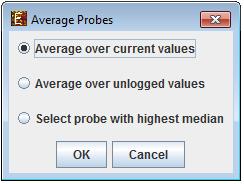
After choosing the preferred merging option or "Matrix gene is based"
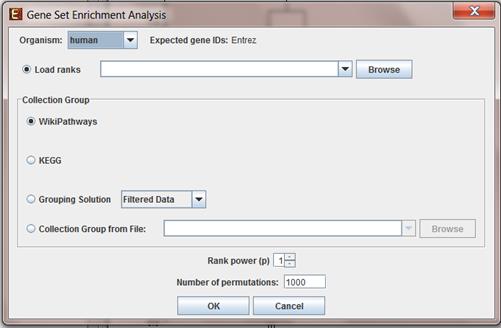
in "ID Type Validation" dialog box, "Gene Set Enrichment
Analysis" dialog box will appear:

The following table specifies the different parameters that can be set via this dialog box:
|
Field |
Description |
|
Load ranks |
User pre-ranked list of genes file composed of two columns û first with genes and second with values |
|
Use condition subset |
Can be used when the matrix is composed of two condition subsets |
|
Condition subset from a File |
A file with a single tab delimited row which contains the phenotype for each condition |
|
Collection Group |
Can be chosen between: WikiPathways, KEGG, a gene-groups solution which was generated in the current session or an external file with gene sets* |
|
Rank Power (p) |
If p=0 then ES is reduced to standard KolmogorovûSmirnov statistic. If p=1then ES is a weighted KolmogorovûSmirnov-like statistic. |
|
Number of permutations |
For estimation of the Significance Level of ES |
*Collection Group File
More gene sets are available to download via MSigDB and files can be loaded via "Collection Group File" field in Collection Group.
The MSigDB gene sets are divided into 7 major collections:
C1.gmt û Positional gene sets
C2.gmt û Curated gene sets
C3.gmt û Motif gene sets
C4.gmt û Computational gene sets
C5.gmt û GO gene sets
C6.gmt û Oncogenic signatures
C7.gmt û Immunologic signatures
For further information, please refer to: http://www.broadinstitute.org/gsea/msigdb/index.jsp
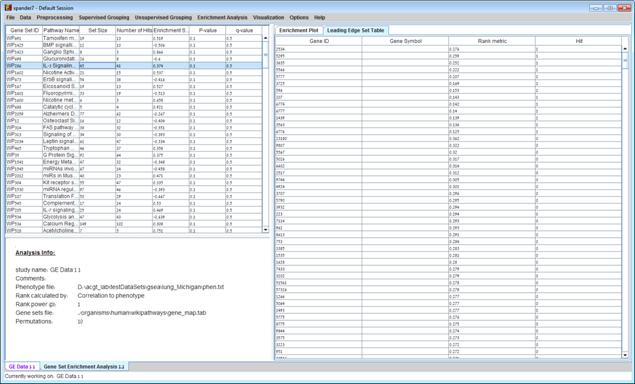
After the analysis is performed a gene set enrichment analysis solution visualization tab is added to the main window. It contains general information regarding the analysis, a sort-able table holding all gene sets (Gene set name, set size, Number of hits, Enrichment score, P-value and q-value(FDR)), an enrichment plot for each gene set selected in the table. The enrichment plot panel contains a graph of the enrichment score for each gene in the ranked list, a bar of hits of the genes in the gene set with the genes in the ranked list and a ranked list metric of the genes, and a tab - leading edge set table that contains Gene ID, Gene symbol, Ranke metric and Hit (if the gene was hit by a gene in the gene set). The leading edge set table contains only genes that appear before the maximum enrichment score.
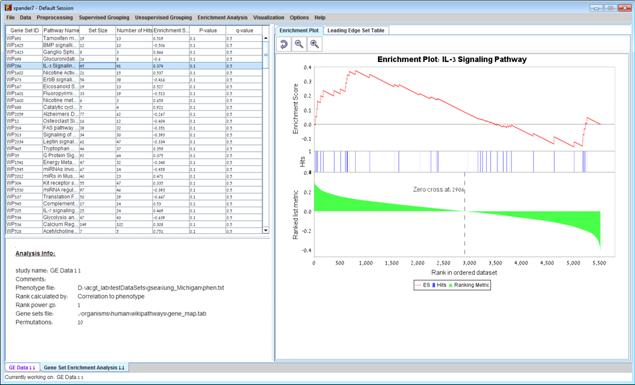
The enrichment plot can be saved as image file by right clicking on the graph->Save asà
The results in the tables can be saved as image file by selecting File>>Save As Image when the corresponding view is the selected tab OR by using the File>>Save All option, which will export all solutions within a session to text and image files.