
CT-FOCS contains more than 229,000 ready to use cell type-specific enhancer-promoter (EP) links, covering three data types: ENCODE, Roadmap Epigenomics, and FANTOM5.
For getting the expression/signal profiles, sample annotations, EP links, ChIA-PET interactions, and more see the Download page.
Please note that the code in this tutorial can be run only on unix platform.
This study was performed under the R statistical language enviroment. Therefore, the following R packages are required for running the CT-FOCS code:
CRAN packages:
 cran_libs =

c('pscl','MASS','parallel','AUC','RColorBrewer','ggplot2','gplots','glmmTMB','nlme','seqinr','MatchIt','S4Vectors','igraph','MatchIt')
Bioconductor packages:
bioconductor_libs = c('GenomicRanges','BSgenome.Hsapiens.UCSC.hg19','biomaRt','topGO')
cran_libs can be installed using install.packages() R function
bioconductor_libs can be installed as follows:
R versions up to 3.4:
source("https://bioconductor.org/biocLite.R")
biocLite("package_name")
R versions 3.5+:
if (!requireNamespace("BiocManager", quietly = TRUE)) install.packages("BiocManager")
BiocManager::install("package_name")
Please download the source code of CT-FOCS from the CT-FOCS github repository:
git clone https://github.com/Shamir-Lab/CT-FOCS.git
cd CT-FOCS
Please download the ENCODE/FANTOM5/Roadmap processed datasets:
wget -P data/ http://acgt.cs.tau.ac.il/ct-focs/data/encode.zip
unzip data/encode.zip -d data/
wget -P data/ http://acgt.cs.tau.ac.il/ct-focs/data/fantom5.zip
unzip data/fantom5.zip -d data/
wget -P data/ http://acgt.cs.tau.ac.il/ct-focs/data/roadmap.zip
unzip data/roadmap.zip -d data/
wget -P data/ http://acgt.cs.tau.ac.il/ct-focs/data/auxData.zip
unzip data/auxData.zip -d data/
wget -P tmp/ http://acgt.cs.tau.ac.il/ct-focs/data/tmpData.zip
unzip tmp/tmpData.zip -d data/
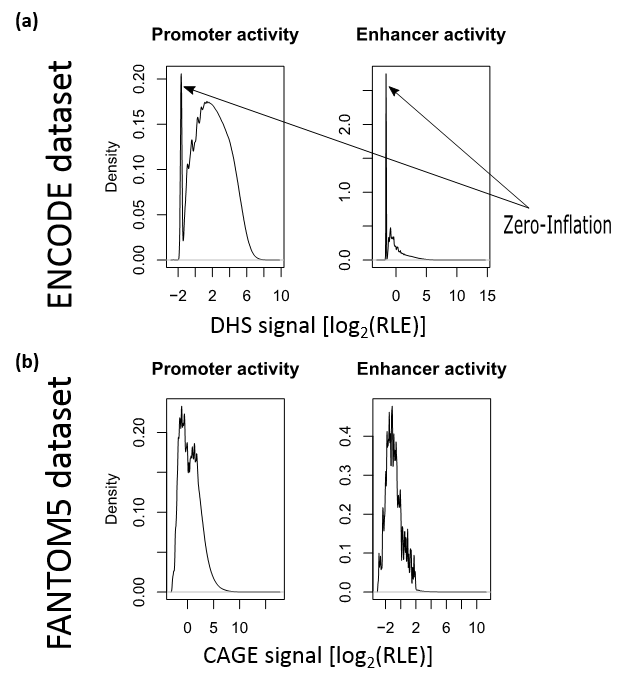
In this part we need to check what is the distribution of ENCODE/FANTOM5 enhancer/promoter activity matrices.
The activity values are relative-log-expression (RLE) normalized and log-transformed (prior count=2). We used edgeR R package for this analysis. Script for this step is available upon request.
This is an importance step that should be done before using the LMM approach.
In LMM we test the goodnest-of-fit of the LMMs compared to the Null hypothesis of the simple linear regression without the random effect component.
To do this test, under the Null hypothesis we need to assume what is the distribution of the residuals. We find this ditribution by analyzing the dataset distribution.
Below we can see a figure showing datasets' distributions.
ENCODE is zero-inflated negative binomial (ZINB) distributed.
FANTOM5 is normal-like distributed.
Script: MAIN_first_step_modeling_part_1.R
Using the first part of the R tutorial script you can perform your own regression analysis with LCTOCV. Using this analysis we apply the ordinary least squares (OLS) regression method.
Later, the results can be used in the second step of the tutorial to infer cell type-specific EP links.
Script: MAIN_first_step_modeling_part_2.R
In this part we analyze the first step regression results to find the robust promoter models for the second step of modeling.
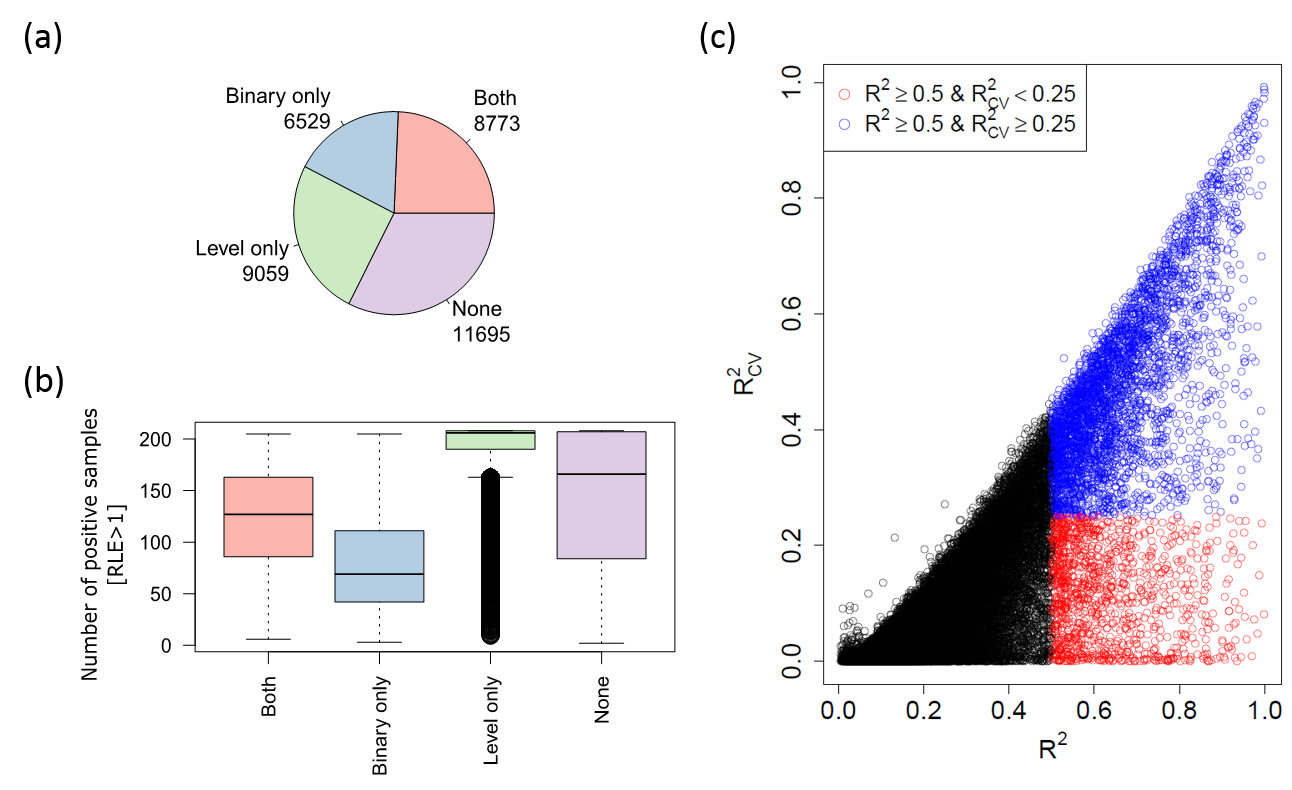
Below we can see a figure summarizing the inferred robust promoter models on the ENCODE data type:
(a) Pie chart showing the number of promoter models passed each of the non-parametric tests under 0.1 Benjamini-Yekutieli FDR: (1) Binary and (2) Activity Level tests
(b) BoxPlot chart showing the number of positive samples (>1 RLE) each model contains in each validation group (Binary only, Level only, both, or None)
(c) Plot c compares the OLS R.squared values with and without cross-validation (CV)
17,832 promoter/gene models passed "Both" and "Level only" validation groups (plot a pie-chart).
The boxplot in plot b demonstrates that in OLS method the "Level only' validation performs better
when many samples are positively expressed (>1 RLE) and "Both" validations perform better when there is a relatively similar number of positively/negatively expressed samples.
Plot c shows that when selecting models with R.squared without CV above 0.5 and R.squared with CV below 0.25 we may suffer from high fraction of false positive models (red dots; empirical FDR ~26%)
due to their sensitivity to CV.
Script: MAIN_second_step_modeling.R
In the second step of the tutorial we apply the CT-FOCS statistical method using LMMs on each survivded promoter model from the first step. This step reduces the number of mapped
enhancer to each promoter and at the same time select EP links that are cell type-specific.
In this step, we need to check what is the underline distribution of the data (please refer to 'Analyzing the dataset distribution' part above)
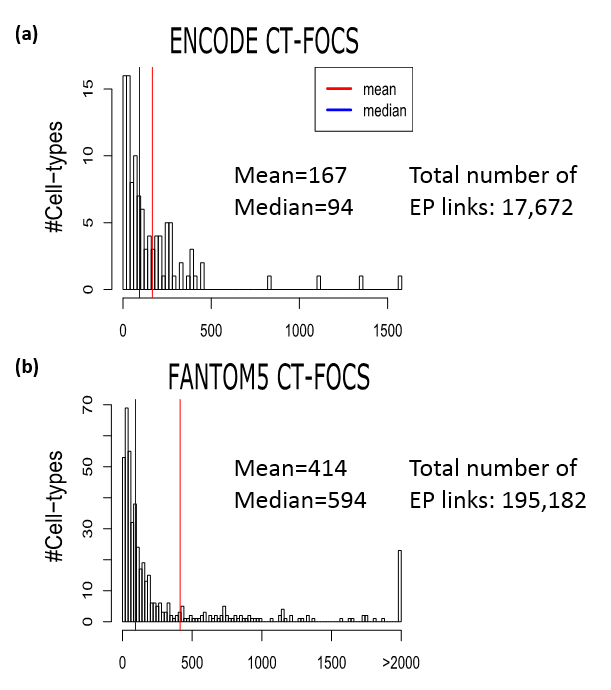
Below we can see a figure summarizing the cell type-specific EP links inferred on the ENCODE and FANTOM5 data types:
Plots a/b shows the frequency of cell type-specific EP links in the ENCODE/FANTOM5, respectivly.
Script: MAIN_ChIA_PET_external_validation.R
In this part of the tutorial we explain how we validate the inferred GM12878-specific EP links with ChIA-PET loops (mediated by POL2 protein).
The validation process is as follows:
(1) We identify ChIA-PET connected loop sets (CLSs), which are connected components with 1 or more loops such that each two loops overlap in their anchros (of size 1000 bp) by at least 250 bp
(2) A true positive (TP) EP link is when the E and P regions (of size 1000 bp) overlap two different anchors (of size 1000 bp) from the same CLS by at least 250 bp
We measure the fraction of supported GM12878-specific EP links with ChIA-PET CLSs.
To infer significance of the fraction of supported GM12878-specific EP links by ChIA-PET CLSs, we perform 1000 random permutation tests. In each permutation, for each promoter (P) with k linked enhancers
we randomly match k new enhancers with similar enhancer-to-TSS distances as the original linked enhancers, restricting the matching to the same chromosome of the original EP links. We use MatchIt R package for the matching.
Then, we test if the fraction of random matched EP links supported by ChIA-PET CLSs is below the true supported fraction of the original EP links.
The empirical P value is defined as the number of permutations with permuted fraction above the true fraction divided by the number of permutations (1000).
Script: MAIN_TF_identification_in_EP_links.R
In this part we provide the code to perform known TF motif finding in inferred cell type-specific EP links.
For more details, please refer to the Methods section in the CT-FOCS paper.
Importatnt - MEME suit installation
you should have an installed MEME suit programs under your Linux OS: MEME suit
After installing the MEME suit you should download the MEME's motif databases: MEME motif databases
The motif databases folder (motif_databases) should be located within meme/db/ folder
Download the file 'HOCOMOCOv11_core_annotation_HUMAN_mono.tsv' from CT-FOCS download page under 'Additional data' table. Insert this file to meme/db/motif_databases/HUMAN/ folder
Script: MAIN_paper_figures.R
In this part we give the code for creating the figures that appear in the paper.