
FOCS contains more than 300,000 ready to use enhancer-promoter (E-P) links, covering four data types: GRO-seq, FANTOM5, ENCODE, and Roadmap epigenomics project.
For getting the expression/signal profiles, sample annotations, E-P links, ChIA-PET interactions, GTEx eQTLs, and more see the Download page.
In the table at the bottom of this page you can get the implementation of useful R functions. To analyze the data follow this tutorial script.
The code first loads all required libraries, data and functions required. Please note yourself that the code can be run only on unix platform.
Afterwards, there are various types of analyses that you can perform: perform regression analysis with leave-cell-type out cross-validation (LCTOCV), enhancer selection in promoter/gene models
using elastic-net (enet), validate inferred E-P links using GTEx eQTLs and ChIA-PET interactions, and in a separate script integrative analysis of the discovered E-P links with eQTLs/ChIA-PET, write visualiztion formats for UCSC
genome browser, and more. Below we give more details on each analysis.
Using the first part of the R tutorial script you can perform your own regression analysis with LCTOCV. Using this analysis you can apply three different regression methods: ordinary least squares (OLS), Generalized linear model with negative binomial (GLM.NB), and zero-inflated with negative binomial (ZINB). Later, the results can be used in the second part of the tutorial script to find the suitable regression method for a given type of data.
In the second part of the tutorial you can analyze part 1 regression results to find the suitable regression method for a given data type.
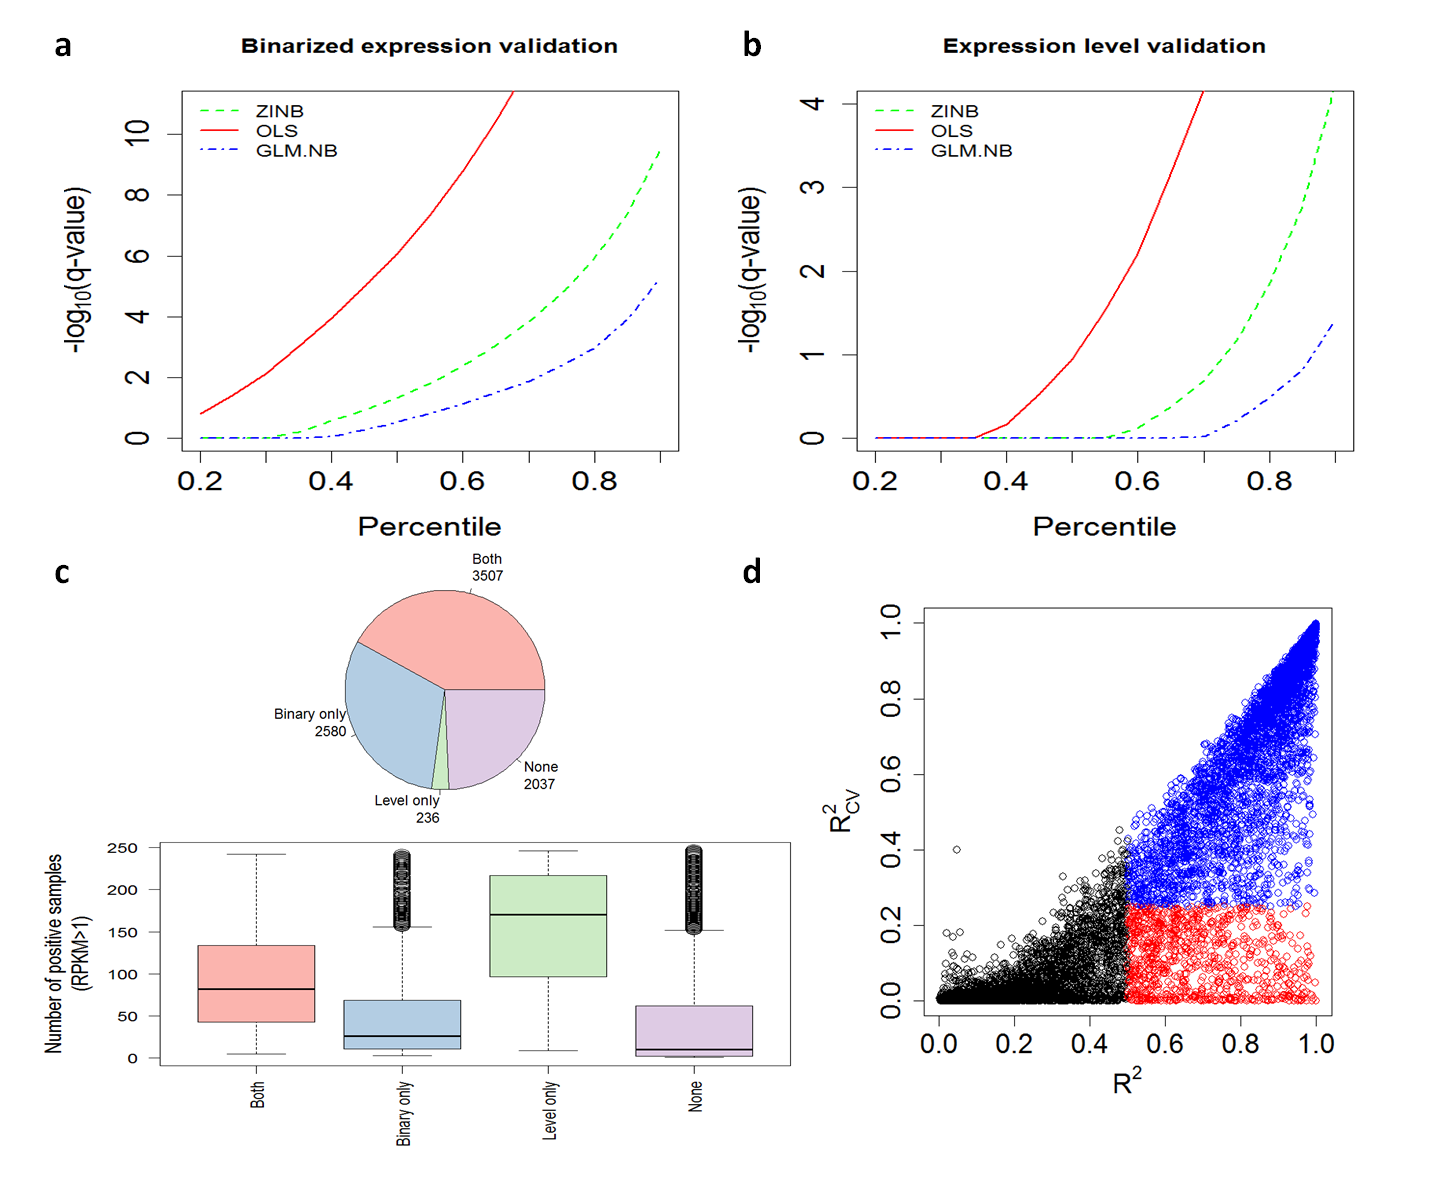
Below we can see a figure summarizing the performances of the each regression method on the GRO-seq data type:
1. Plots a-b show the q-values in each validation test as function of the number of models above a certain q-value (i.e., percentiles)
2. Plot c shows the number of OLS promoter/gene models with q-value below 0.1 in "Both" validation groups, in "Binary only" group, in "Level only" group, or "None" of them.
In addition, plot c shows as boxplot the number of positive samples (>1 RPKM) each model contains in each validation group.
3. Plot d compares the OLS R.squared values with and without cross-validation (CV).
According to plots a-b, the OLS method is the most suitable regression method for GRO-seq data type.
6,323 promoter/gene models passed "Both", "Level only", and "Binary only" validation groups (plot c pie-chart).
The boxplot in plot c demonstrates that in OLS method the "Level only' validation performs better
when many samples are positively expressed (>1 RPKM) and "Both" validations perform better when there is a relatively similar number of positively/negatively expressed samples.
Plot d shows that when selecting models with R.squared without CV above 0.5 and R.squared with CV below 0.25 we may suffer from high fraction of false positive models (red dots; empirical FDR ~22%)
due to their sensitivity to CV.
In the third part of the R tutorial script you can apply the elastic-net (enet) enhancer selection on each survivded model from the second part. This is an important step as it reduces the number of enhancers
in each model in order to prevent over-fitted model to the training set.
In the first step, called 'eBY filtering', we mark "important" enhancers that should appear in the model after the enet process (see paper for further details).
In the second step, we apply the enet on each model and make sure that models with survived enhancers from the first step will also survive the enet step. In this step we also
make sure that each model will have at least one survived enhancer.
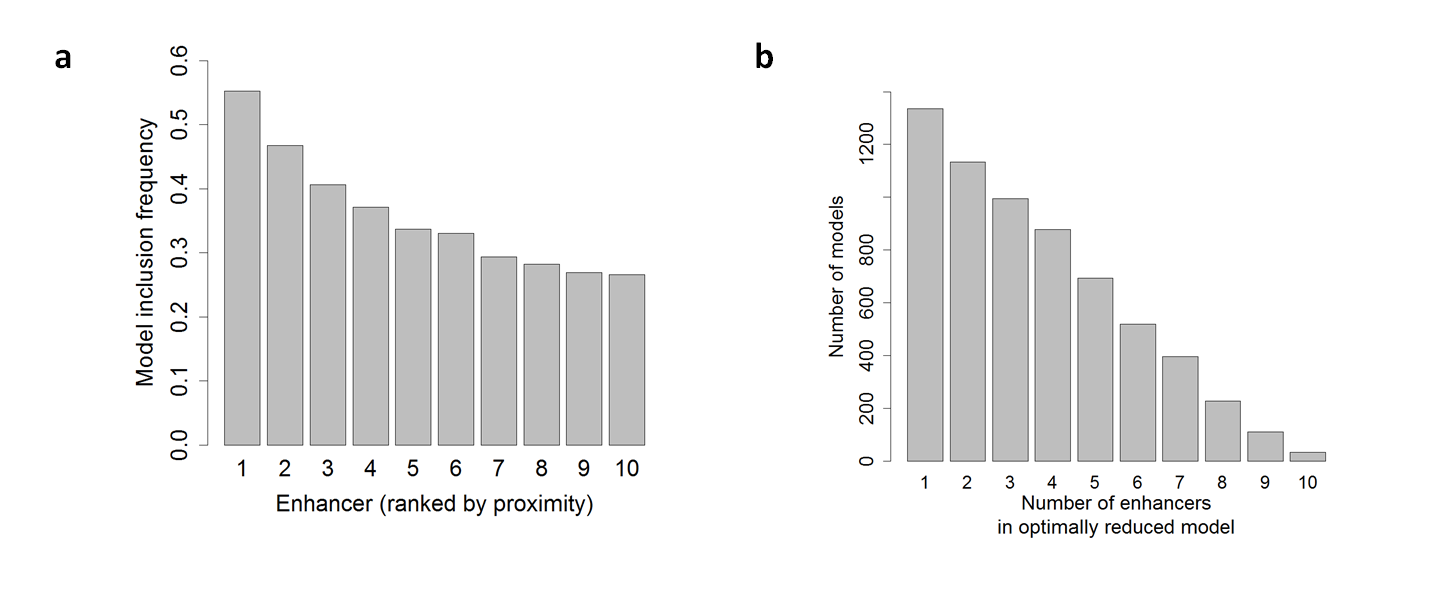
Below we can see a figure summarizing the enhancer selection part on the GRO-seq data type:
1. Plot a shows the frequency of enhancers included in the shrunken models according to their distance from the TSS (1 is closest).
2. Plot b shows the number of optimal (shrunken) models with 1-10 enhancers.
According to this figure, ~55%/~48% of the promoters (models) were linked to the first/second enhancer (plot a), and most models did not include 1-3 enhancers (plot b) compared to other data-types
such like ENCODE/FANTOM5 suggesting an interesting behavior in GRO-seq data type (see paper for further details).
In the forth part of the R tutorial script you can validate your inferred E-P links with two external sources: ChIA-PET interactions (mediated by POL2 protein) and GTEx eQTLs.
We measure the fraction of supported E-P links with ChIA-PET/eQTLs. In ChIA-PET, each two genomic positions of an E-P pair are intersected with two genomic positions of two interaction anchors.
In eQTLs, we identify the set of associated SNPs to the promoter annotated with a known gene and search for intersection between each SNP with the linked enhancer genomic positions.
A pair of E-P is supported by ChIA-PET/eQTLs if and only if the pair intersected by at least one interaction or one associated SNP to the promoter.
To infer significance of the fraction of supported E-P links by ChIA-PET/eQTLs, we perform 100 random permutation tests. In each permutation, for each promoter (P) with k linked enhancers
we randomly select k new enhancers with similar enhancer-to-TSS distances as the original linked enhancers. Then, we test if the fraction of permuted E-P links supported by ChIA-PET/eQTLs
is below the true supported fraction of the original E-P links. The empirical P-value is defined as the number of permutations with permuted fraction above the true fraction divided by the number of permutations (100).
In this part we implemented in a script different methods for analyzing and accessing the inferred E-P links.
This script can be run on both Windows and Unix platforms.
The script allows you to:
1. Retrieve E-P links whose promoter is annotated with a user supplied gene identifier. Supported gene identifiers are: Ensembl, NCBI/entrez, and gene symbol.
2. Annotate a set of E-P links with ChIA-PET interactions and/or eQTLs.
3. Write the genomic positions of the E-P links in BED12 file format to visualize them in UCSC genome browser by adding custom track .
| Name (link) | Description |
|---|---|
| Tutorial | A tutorial on how to use our code and data for generating results. For example, running regression analysis with cross-validation, or E-P validation with ChIA-PET/eQTLs |
| Integrative analysis tutorial | A tutorial on how to get genomic positions of E-P links, or finding associated eQTLs and overlapping ChIA-PET interactions, and more |
| Functions for regression analysis | Implementations of methods for performing regression analysis with cross-validations |
| Functions for E-P validation | Methods that were used when validating true E-P links with GTEx eQTLs and ChIA-PET interactions |
| Functions for E-P visualizations | Implementations of methods for exporting E-P links to visualization in UCSC |