Expander provides two types of scatter plots visualizations that can be operated via Visualization >> Scatter Plots...
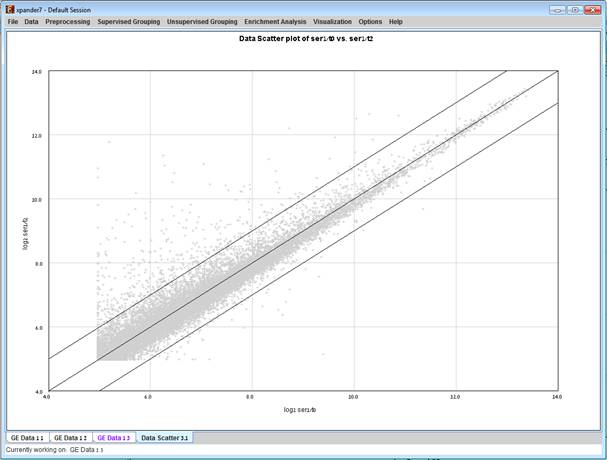
Simple plot - Displays a scatter plot of two arrays (selected by the user), in which the ith point (xi,yi) represents the expression value (log expression for un-logged data) of the ith gene in one array vs. the other. For normalized data, points should be located around the y=x line (marked on the scatter plot).
Ā
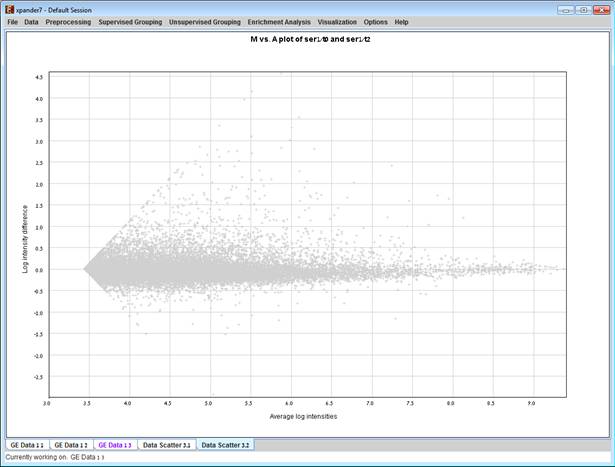
M vs. A plot (available only for absolute intensities data) - Displays a scatter plot in which each point (Ai,Mi) represents the log intensity difference of the i th probe in the two arrays (selected by the user) vs. the average log value of these intensities.