Expander operates on two types of data:
a) Gene expression data – can be either relative intensities data, expected as log 2 (R/G) values data (e.g. cDNA microarrays) OR absolute intensities data, expected as positive expression levels (E.g. High-density oligonucleotide data). Oligonucleotide data can be loaded with/without detection. It can also be loaded from CEL files (If R is installed).
If one wishes to perform functional analysis or promoter analysis, an ID conversion file should be loaded along with the data file. The conversion file maps each probe ID (first column) in the data file into a corresponding conventional gene ID that is used in the GO annotation and TF fingerprint files that are supplied with EXPANDER. The conversion file can be loaded in the middle of the session too, by Data >> Load Conversion File.
b) Gene sets data – contains predefined sets of genes. In this data
type, the conventional gene IDs that are used by EXPANDER in the GO annotation
and TF fingerprint files are expected.
For details regarding the Gene ID convention that is used for each organism, refer to the Supplied Files section.
For details regarding the data files formats see the File Formats section.
Loading gene expression data:
To load tabular expression data, select: File >> New Session. From the submenu select Expression Data >> Tabular Data File.
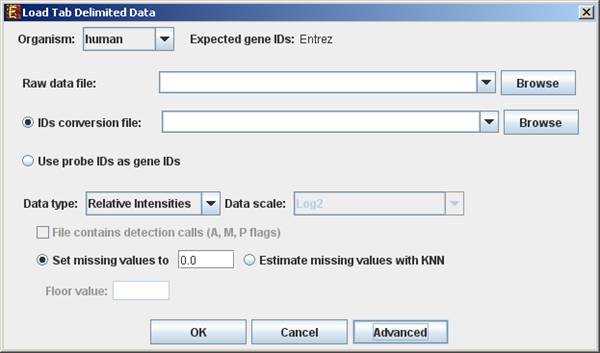
When selecting Tabular Data File, the following dialog box will appear:
Data type and scale are to be determined according to the input file. If the file contains missing values, these values will be estimated upon loading the data either by setting them to and arbitrary value (if the ‘Set missing value to ____’ option is selected) or by utilizing the KNN (K-Nearest Neighbors) method (if the ‘Estimate missing values with KNN’ option is selected). If the file contains Affymetrix detection calls data, the relevant check box must be checked. You may change / erase the default floor value, to which all entries that are below that value will be set (this option is available only for absolute intensities data).
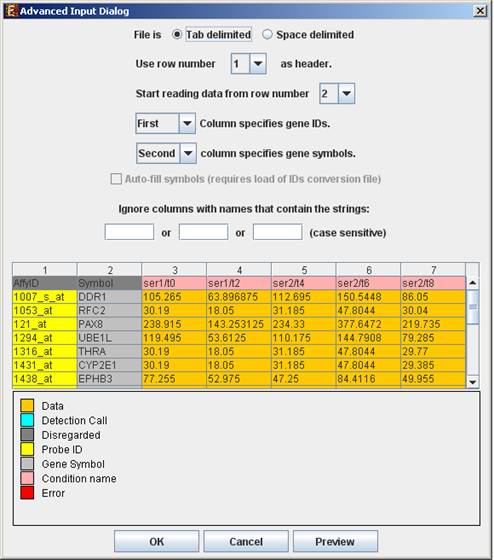
Advanced Input Dialog: Upon pressing the ‘Advanced’ button after filling the ‘Raw Data File’ field, an ‘Advanced Input Dialog’ appears. This dialog box can be used in order to facilitate the data load of files that are not in the required format. The first few rows and columns of the data are displayed in a table, demonstrating the way the data is read by the program according to the current input values.
To load expression data from CEL files, select: File >> New Session. From the submenu select Expression Data >> CEL Files.
The load of CEL requires installation of R software (see R External Application section) along with specific packages, as detailed below. An open internet connection is also required for this operation.
Expander supports CEL files of three chip types:
When selecting CEL Files, the following dialog box will appear:
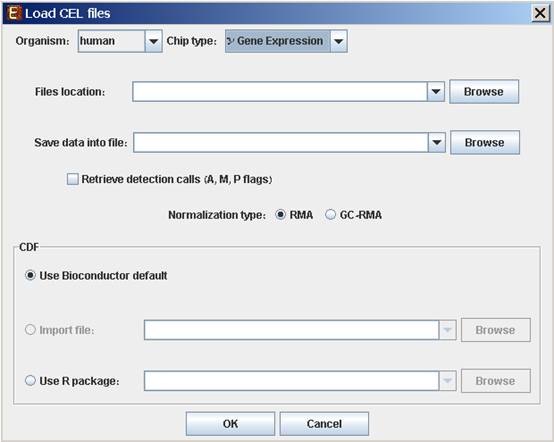
Please choose the relevant organism and chip type. Then browse to the folder where the CEL files are located (Files location), and choose where to save the expression file resulting from the CEL files preprocessing.
Preprocessing and normalization method: The default method in Expander is RMA. However, for 3' gene expression arrays, you may select GC-RMA instead (taking into account GC-content bias). Before using GC-RMA, please make sure you have the “gcrma” R package installed (see R External Application section).
CDF environment choice: You may use the default Bioconductor CDF environment for the chips or browse to an alternative CDF package which you have already installed in R. For whole transcript and alternative splicing chips (for which there is no default Bioconductor CDF environment), you can either supply an alternative CDF package or a CDF file suitable for the chip (see links below).
Note: GC-RMA requires the probe sequence information of the chip. If you decide not to use the default Bioconductor CDF environment, and have GC-RMA as the preprocessing method, you must have the suitable probe package installed in addition to the CDF alternative package.
Links for downloading CDF files (available at aroma.affymetrix Google group pages):
Note that new CDF files may become available before we get to adjust our links accordingly.
For Exon chips, there are other CDF files available from aroma.affymetrix group. The links we supplied are for core CDF files, which allow faster analysis than the 'extended' or 'full' CDF files.
If Expander cannot find your R software, a window will appear, asking you to specify its location. Please browse to the location of your R software. In Windows, R.exe file is likely to be located in the 'bin' folder of R software. In Linux, you may type 'which R' in the command line to find R path. If you have a few versions of R installed, please make sure to point Expander to a version in which the Bioconductor “affy” and/or “aroma.affymetrix” packages have been installed.
Once the CEL files preprocessing is done, a corresponding tabular data file is generated and a 'Load Study' dialog will appear, as in loading Tabular Data.
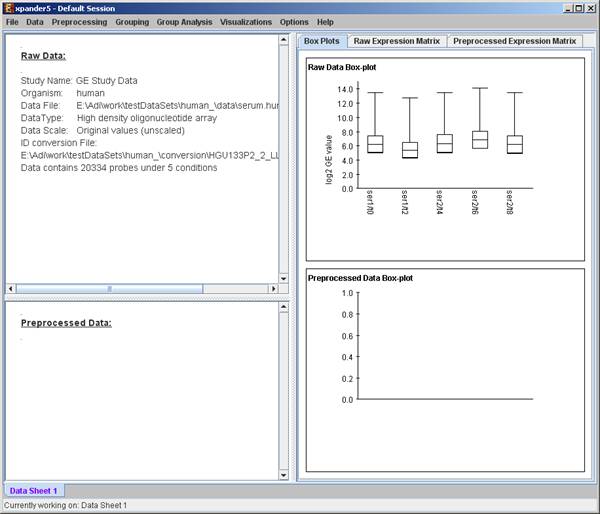
After loading a gene expression data set, a ‘Session Data’ display tab is added to the main window (see example below). It contains information regarding the raw data file, a box plot chart, and an expression matrix visualization of the raw data. If detection calls exist in the data file, their statistics for each probe appear in 3 columns in the heat maps (expression matrices), in a scale between 0 and 1, corresponding to the relative part of each of the detection calls (P, M and A). The detection calls statistics for each condition are displayed in a separate tab in two tables (one for the raw data and another for the preprocessed data) and are presented in percent.
Loading gene sets:
To load Gene Sets data select File>>New Session. From the submenu select Gene Sets.
The following dialog box will appear:
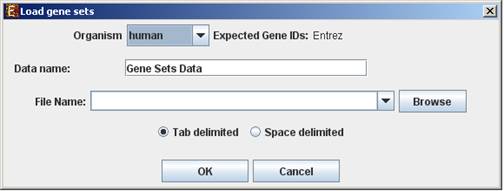
For details regarding the data files formats see the File Formats section.
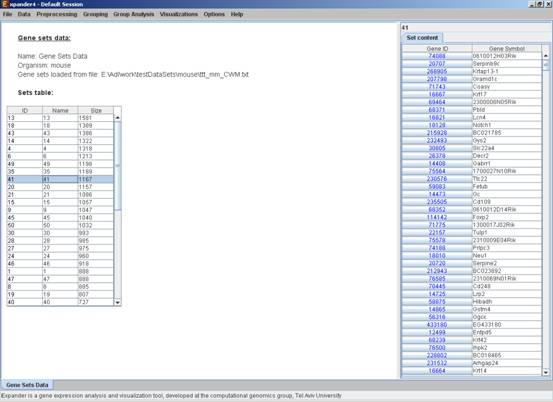
After loading a gene sets data, a ‘Session Data’ display tab is added to the main window (see example below). It contains information regarding the data file, and a table describing the different sets (set number, name and size). Set names can be modified, by editing the corresponding cell in the table. Upon clicking on a row in the table, the corresponding set pane appears on the right. It contains a list of the genes in the set and a view of their chromosomal locations. If a network file has been loaded (via Data>>Load Network), the sub-graph, induced by the set is displayed as well.