Understanding Modules Figures
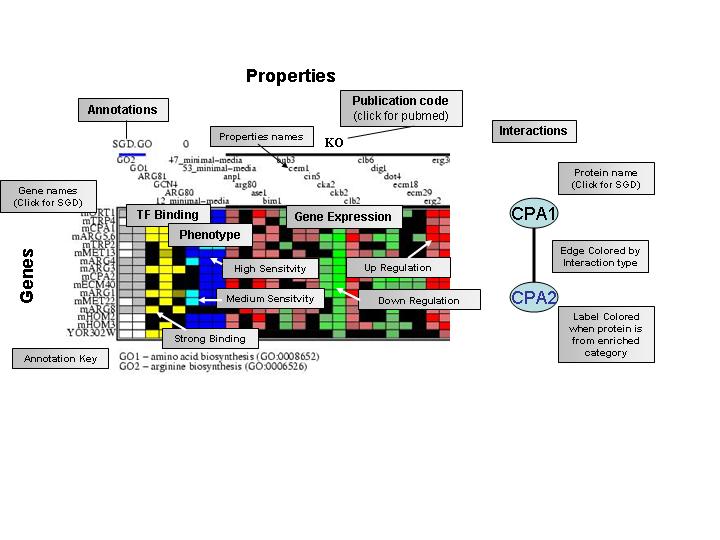
The module interactive figure can help you analyze groups of genes
and their common behavior across sets of diverse properties. Use the tooltips
(by pointing to gene names or property names) for detailed examination of
what is known about the elements of the module. Use the links to PubMed and
SGD (by clicking on the labels) to continue your exploration.
Types of properties are represented using different color scales, green to
red for gene expression, yellow for TF binding, blue for phenotypes.