PIVOT's Features
 |
PIVOT's Features |
PIVOT offers features, which help users navigate around the interactions map, and manipulate it.
|
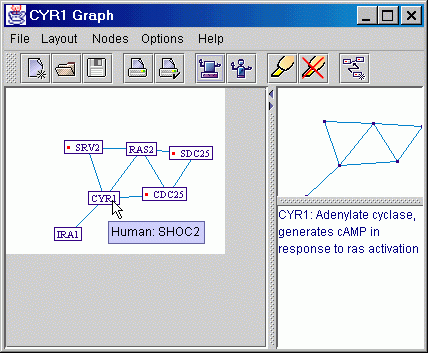
By placing the mouse cursor on any map protein, basic information regarding that protein's function, will be displayed, as well as its human homolog. The user can double click a map protein, in order to add to the map all the proteins which interact with it. A protein that has interacting partners which are not displayed on the map, is marked with a red dot next to its designation. The user can also choose to open a detailed information page from the Internet, for any map protein. A "Satellite View" is available on the main screen, which displays the complete map, even when the detailed map becomes too large to fit in the main screen. |
 |
|
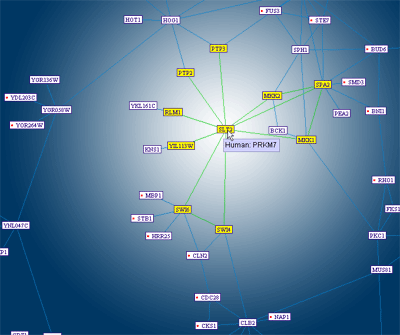
The "Neighbors Marker"
tool, helps the user interpret dense areas of the graph. When turned on,
it highlights all of the immediate neighbors of any map protein the user
points at (i.e. all of the map proteins interacting with it directly).
|
 |
|
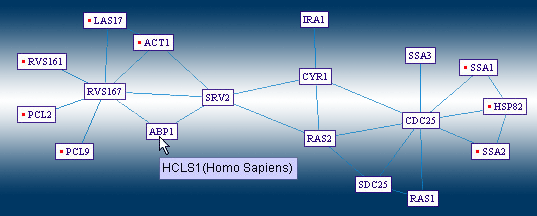
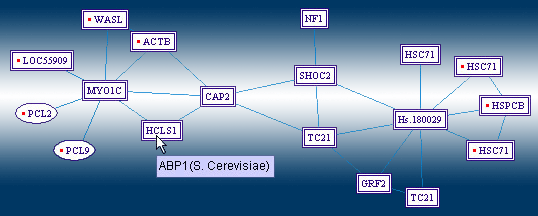
The "Human Homologs View" would switch the displayed protein designations, with those of the homolog proteins in human. This makes the map easier to read for users who study human proteins, by displaying the yeast interactions, as potential interactions among human proteins. Yeast proteins, whose human homolog is unknown, are displayed using their yeast designation, and marked by a surrounding ellipse. |
 |
|
| |
||
 |
Several other features help the user expand the displayed map, according to different needs.
|
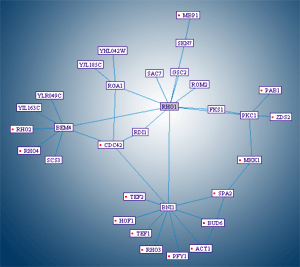
The user might want to view the entire "neighborhood" of his protein of interest. He can choose the "distance" of the farthest neighbor, and let PIVOT expand the map to display all proteins up to the specified distance.
|
 |
|
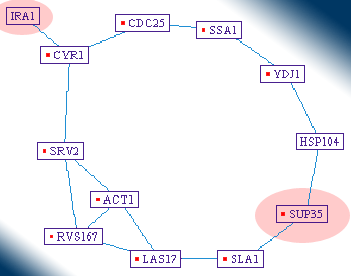
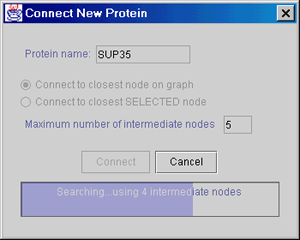
For finding the shortest path of interactions, connecting several distant proteins to each other, some graph theory algorithms are integrated into PIVOT. The user can request the software to connect a new distant protein to the displayed map, using the shortest path of interactions available in the database (a task which is practically impossible to perform manually). |
 |
|
 |
 |
|
| Using this feature, the researcher can unfold the relationships among "distant" proteins, which respond similarly under the experiment's conditions. |