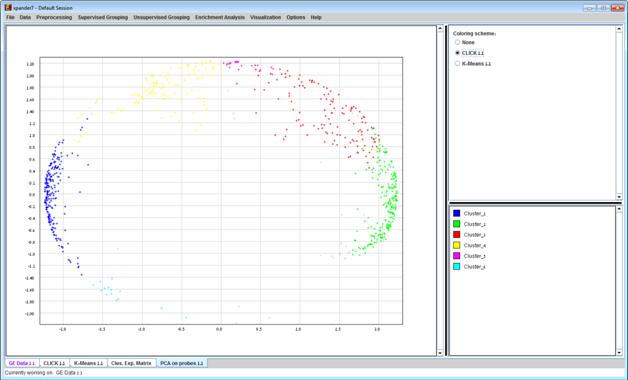
This tool transforms the original data from a k (original pattern length) to a 2 dimensional space, so that each expression vector is represented by a dot on an XY scatter chart. The transformation is based on the PCA (Principal Component Analysis) algorithm. To operate the tool, select Visualization >> PCA.
If a clustering solution has been previously created, its’ name appears next to a radio button in the top right panel. Upon pressing this button, the color of each dot in the display changes according to the cluster assignment of the corresponding probe. The color index at the bottom right panel, maps each color to the index of the corresponding cluster.