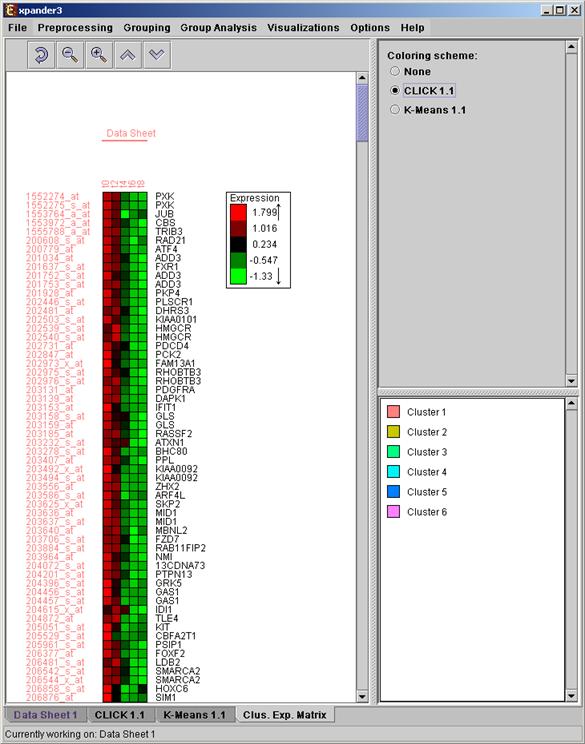
An expression matrix (Heat-map) visualization
is integrated in many of EXPANDER’s displays. This visualization is similar to
the red-green matrix representation of Eisen et al (1998). All it does is
to render the gene-expression data on the screen in color, where green
indicates under expression, and red indicates over expression. Color rendering
can be configured by the user in one of the following manners: (a) by setting
the range (top and bottom values) of rendered values (default values are set
according to the data scale, e.g. 40-1000 for non-standardized absolute
intensities data) or (b) by setting the percent of values, which are to be
disregarded as extreme values from each edge (by default set to 5%). The manner
of color scale configuration (i.e. (a) vs. (b)) can be set via the ‘Data Matrix
View’ tab in the ‘Display Settings’ dialog box, available from Options
>> Settings. The red/green coloring scheme can be changed to
blue/yellow (using Options >> Settings >> Display
>> ‘Data Matrix View’ tab).
A color scale appears next to the matrix
(upper right side). The displayed tool tip shows the probe ID and condition
title corresponding to the row and column on which the cursor is placed, and
the expression value in that position. The matrix toolbar contains zoom
in, zoom out, reset scale (to reset zoom factor), shorten condition title and
Elongate condition title tools.
Upon selecting Visualization >>
Clustered Expression Matrix, a clustered expression matrix visualization
tab is added to the main window. The probes are ordered in their original
order. If a clustering solution has been previously created, its’ name appears
next to a radio button in the top right panel. Upon pressing this button, the
order of the probes in the display changes and probe IDs are colored according
to the clusters. The color index at the bottom right panel, maps each color to
the index of the corresponding cluster.