The following analysis can be performed on clusters or biclusters.
Functional Analysis:
This tool performs basic statistical analysis on the distribution of functions of genes within each cluster. The functions of the genes are determined according to an annotation files (GO), which can be downloaded from the EXPANDER download page (see the Supplied Files section). To perform this analysis, Expander utilizes the TANGO software, which performs hyper-geometric enrichment tests and corrects for multiple testing by bootstrapping and estimating the empirical p-value distribution for the evaluated sets.Ā
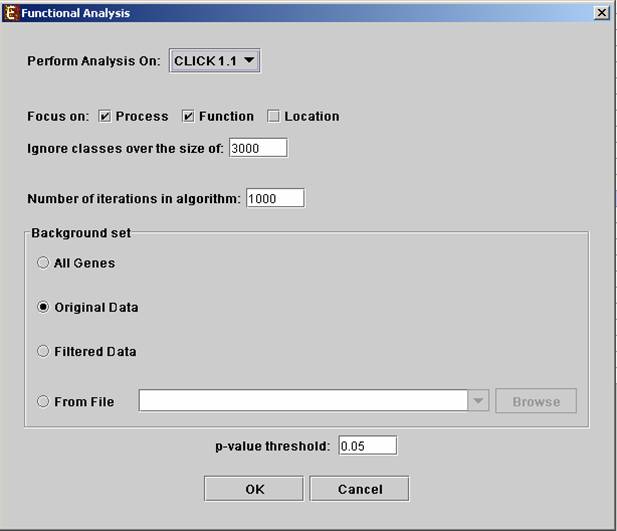
Before operating functional analysis the annotation files for the relevant organism should be downloaded from the download page. To perform the analysis select Group Analysis>>Functional Analysis>>TANGO. The following dialog box will appear:Ā
The following table specifies the different parameters that can be set
via this dialog box:
Ā
|
Field |
Description |
|
Perform analysis on |
The grouping solution on which the analysis will be performed. |
|
Focus on |
Can be used to select annotation subtypes that are of interest (Process, Function and Location). And the analysis will focus on these types only. |
|
Ignore classes over the size of |
This parameter states the level in the GO tree at which annotations are too general (class size indicates how general it is) and are thus no longer interesting. |
|
Number of iterations in algorithm |
The number of random sampling performed by the algorithm. Increasing this parameter, will increase runtime and will provide higher resolution on corrected p-Values. I.e., corrected p-Values will range between 1/<#iterations> and 1. |
|
Background set |
Determines the set of genes that will be used as background in the analysis. Options are: all genes (of the relevant organism), original input data, filtered data or background set from file (see the Files Format section for details regarding the format of an external background set). |
|
Corrected p-value threshold |
A functional class will be considered significantly enriched in a cluster/bicluster if its corrected p-value is lower than this threshold. The value in this field should be at least 1/1000, since the TANGO algorithm performs 1000 bootstraps in order to estimate the corrected p-value. |
Upon clicking ōOKö in the dialog box, the TANGO algorithm is operated.
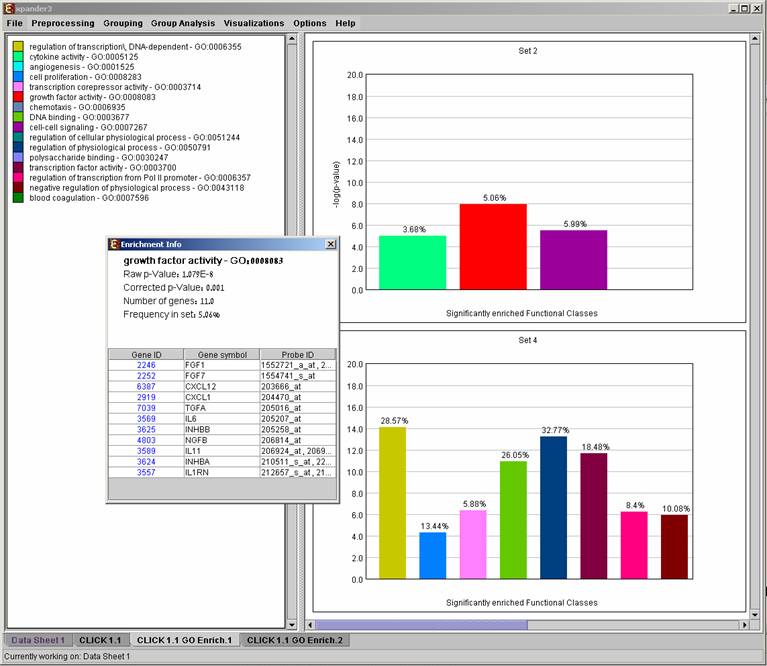
After functional analysis is performed a functional analysis solution visualization tab is added to the main window. The results are displayed using a histogram for each cluster/bi-cluster in which enrichment has been detected. Each histogram contains a column for each significant (more frequent than would be expected by random) functional class. The definition of significant depends on the userÆs selection of threshold p-value. i.e., a functional class is considered significantly enriched in a cluster/bicluster if its corrected p-value is lower than the preset threshold p-value.
The height of the column is proportional to the significance of this enrichment (i.e. height = -log(raw p-value)). The frequency in set (frequency of binding site within the examined set, in %) of the class in the cluster is written on top of the column.Ā Upon clicking on a column, a dialog box is displayed containing the class name, raw p-value, corrected p-value, and a list of the genes in the cluster/bi-cluster that belong to the class. Upon clicking on one of the gene Ids in the table, a relevant web page with information regarding this gene is displayed. The display tool tip shows the cluster number, size and homogeneity.
Annotation files are currently supplied with EXPANDER for yeast, human, mouse, rat, fly, zebrafish and c-elegans and will be updated on a regular basis (for more information, refer to the Supplied Files section).
The results of this analysis can be exported to a text file (using the display menu item Group Analysis>>Functional Analysis>> Export results). The format of the produced text file is as follows:
Cluster: <cluster number>, size: <cluster size>
<enriched functional class 1>
=================
p-value = <p-value>
<gene Id>; <gene symbol>; <probe1 id>, <probe2
id>...
<gene Id>; <gene symbol>; <probe1 id>, <probe2 id>...
.
.
.
<enriched functional class 2>
=================
p-value = <p-value>
<gene Id>; <gene symbol>; <probe1 id>, <probe2
id>...
<gene Id>; <gene symbol>; <probe1 id>, <probe2 id>...
.
.
.
etc.
Promoter Analysis:
This tool identifies TFs whose binding sites are significantly over-represented in a given set of promoters (i.e. cluster or bicluster). To perform this analysis Expander utilizes the PRIMA (PRomoter Integration in Microarray Analysis) software which performs a statistical analysis on the distribution of transcription factor motifs in the promoters of genes within each cluster or bicluster. To achieve this, PRIMA uses preprocessed TF fingerprint files, which can be downloaded from the EXPANDER download-page (see the Supplied Files section), and are updated on a regular basis.Ā For details regarding the PRIMA software see the References section.
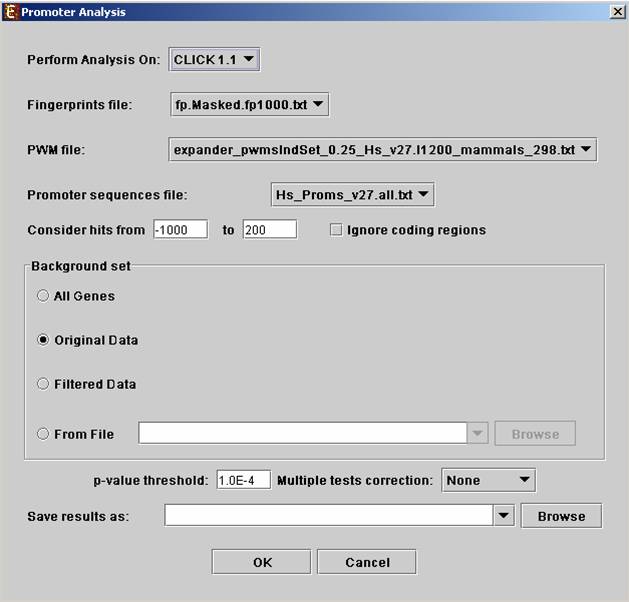
Before operating promoter analysis, the TF fingerprint file for the relevant organism should be downloaded from the download page. To perform the analysis select Group Analysis>>Promoter Analysis>>PRIMA. The following dialog box will appear:
 Ā
Ā
The following table specifies the different parameters that can be set via this dialog box:
|
Field |
Description |
|
Perform analysis on |
The grouping solution on which the analysis will be performed. |
|
Fingerprints file |
Automatically set according to the selection of the organism. |
|
PWM file |
Automatically set according to the selection of the organism. |
|
Promoter sequences file |
Contains the gene sequences that are used for the TF binding sites display. Automatically set according to the selection of the organism. |
|
Hits range |
Determines which regions of the gene are to be analyzed.Ā The possible range depends on the investigated organism (i.e. on the information provided in the TF fingerprint files), and is specified in the Supplied Files section. |
|
Background set |
Determines the set of genes that will be used as background in the analysis. Options are: all genes (of the relevant organism), original input data, filtered data or background set from file (see the Files Format section for details regarding the format of an external background set). |
|
Threshold p-value |
A TF's binding site will be considered significantly enriched in a cluster if its corrected p-value is lower than this threshold. |
|
Multiple tests correction |
Can be set to Bonferroni or None (when set to Bonferroni the corrected p-values are the ones that are compared to the threshold p-value) . |
|
Save results as |
When filled, the program results are saved in stated txt file. |
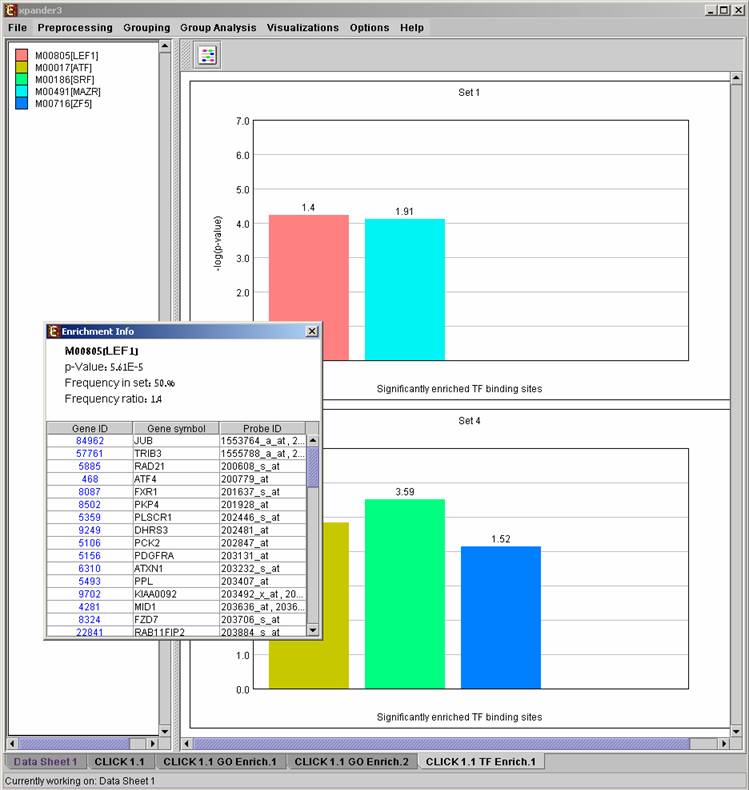
After promoter analysis is performed, a promoter analysis solution visualization tab is added to the main window. The results are displayed using a histogram for each cluster/bi-cluster in which enrichment has been detected. Each histogram contains a column for each significant (more frequent than would be expected by random) TF binding site. The definition of significant depends on the userÆs selection of threshold p-value. i.e., a TF binding site is considered significantly enriched in a cluster/bicluster if its corrected p-value is lower than the preset threshold p-value.
The height of a column is proportional to the significance of this enrichment (i.e. height = -log(p-value)), and the frequency ratio (in %) of the class in the cluster vs. the background set is written on top of the column. Upon clicking on a column, a dialog box is displayed containing:
TF accession number in TRANSFAC DB [TF name], p-value, % of covered promoters in cluster, relative frequency (frequency in cluster divided by frequency in background set) and a list of the genes in the cluster which contain the motif in their promoters. Upon clicking on one of the gene Ids in the table, a relevant web page with information regarding this gene is displayed. The display tool tip shows the cluster number, size and homogeneity.
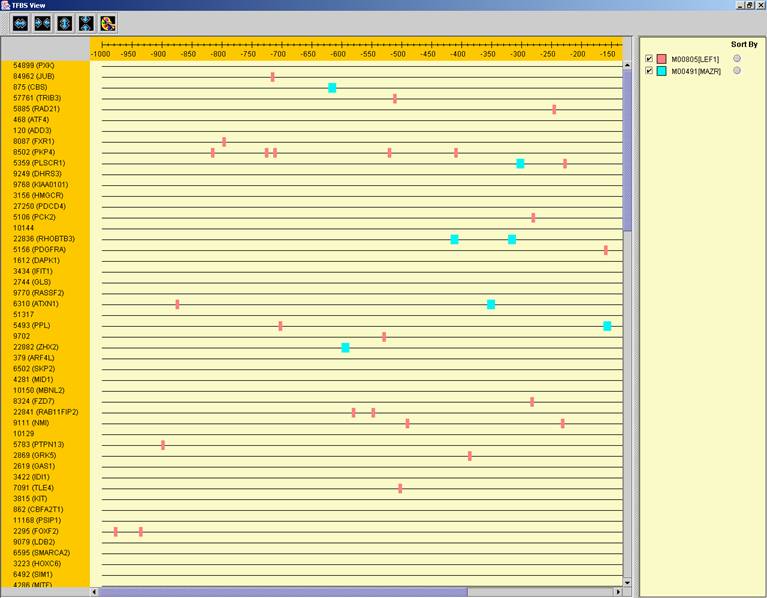
After performing promoter analysis, TF binding sites can be viewed by
selecting Group Analysis>>Promoter Analysis>>View Binding Sites OR
by pressing the toolbar button (![]() ). After selecting the set
(cluster/bi-cluster) to be viewed, a separate frame is displayed, containing a
line to represent each of the genes in the set, and a colored rectangle, to
represent each binding site. A color index appears on the right, mapping each
color to the corresponding TF (PWM). A check box next to each of the entries in
the color index allows hiding any of the PWMs, and a radio button next to each
of the entries in the color index allows sorting the genes in the display
according to the number of hits of the corresponding TF. The toolbar contains
tools for vertical and horizontal zooming. If a sequence file had been selected
via the promoter analysis input dialog, the actual sequence will be displayed
when the zoom factor (scale) allows it.
). After selecting the set
(cluster/bi-cluster) to be viewed, a separate frame is displayed, containing a
line to represent each of the genes in the set, and a colored rectangle, to
represent each binding site. A color index appears on the right, mapping each
color to the corresponding TF (PWM). A check box next to each of the entries in
the color index allows hiding any of the PWMs, and a radio button next to each
of the entries in the color index allows sorting the genes in the display
according to the number of hits of the corresponding TF. The toolbar contains
tools for vertical and horizontal zooming. If a sequence file had been selected
via the promoter analysis input dialog, the actual sequence will be displayed
when the zoom factor (scale) allows it.
TF motif fingerprint files and promoter sequence files are currently supplied with EXPANDER for yeast, human, mouse, rat, fly, zebrafish and c-elegans and will be updated on a regular basis (for more information, refer to the Supplied Files section).
The results of this analysis can be exported to a text file (using the display menu item Group Analysis>>Functional Analysis>> Export results). The format of the produced text file is as follows:
Cluster: <cluster number>, size: <cluster size>
<enriched PWM1 name>
=================
p-value = <p-value>
<gene Id>; <gene symbol>; <probe1 id>, <probe2
id>...
<gene Id>; <gene symbol>; <probe1 id>, <probe2 id>...
.
.
.
<enriched PWM2 name>
=================
p-value = <p-value>
<gene Id>; <gene symbol>; <probe1 id>, <probe2
id>...
<gene Id>; <gene symbol>; <probe1 id>, <probe2 id>...
.
.
.
etc.