Expander provides two types of scatter plots visualizations that can be operated via Preprocessing >> Normalization >> View Scatter Plots.
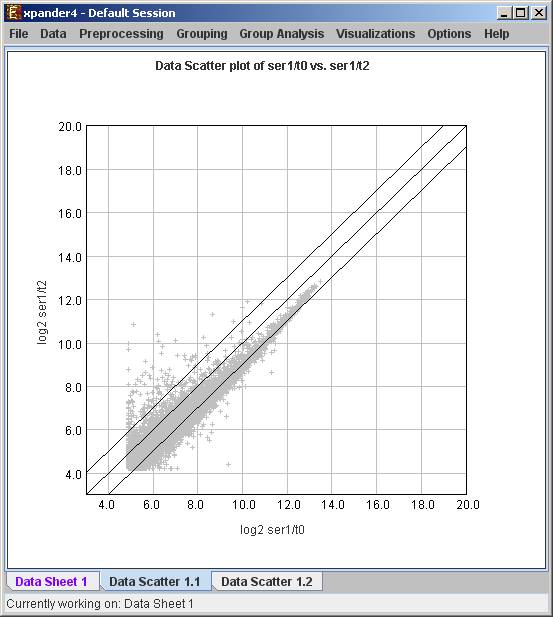
Simple plot - Displays a scatter plot of two arrays (selected by the user), in which the ith point (xi,yi) represents the expression value (log expression for oligonucleotide data) of the ith gene in one array vs. the other. For normalized data, points should be located around the y=x line (marked on the scatter plot).
Ā
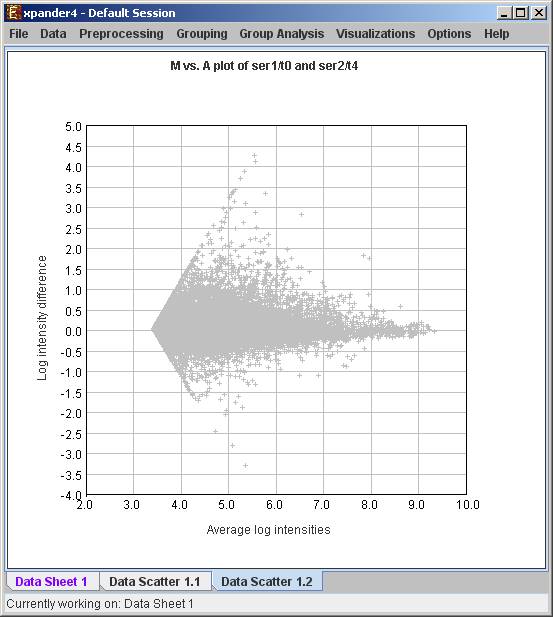
M vs. A plot (available only for oligonucleotide data) - Displays a scatter plot in which each point (Ai,Mi) represents the log intensity difference of the i th probe in the two arrays (selected by the user) vs. the average log value of these intensities.